Iris數據集LDA和PCA二維投影的比較?
Iris數據集代表了3種鳶尾花(Setosa、Versicolour和Virica)的4個屬性:萼片長度、萼片寬度、花瓣長度和花瓣寬度。
應用于該數據的主成分分析(PCA)確定了屬性(主成分,或特征空間中的方向)的組合,這些屬性在數據中的方差最大。在這里,我們繪制了兩個第一主成分的不同樣本。
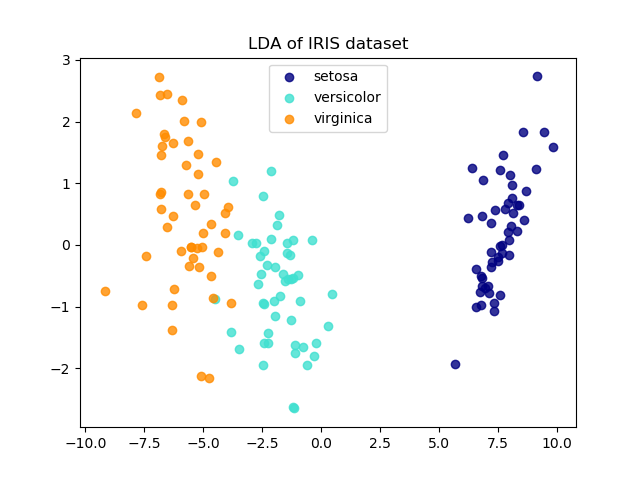
線性判別分析(LDA)試圖識別類間差異最大的屬性。特別是,與PCA相比,LDA是一種監督方法,使用已知的類標簽。
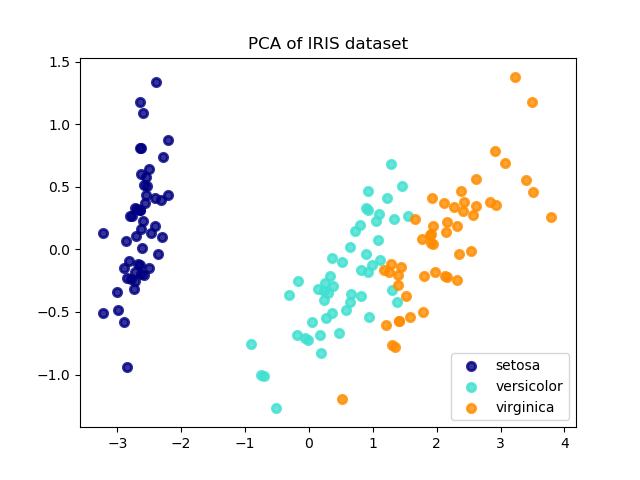
explained variance ratio (first two components): [0.92461872 0.05306648]
print(__doc__)

import matplotlib.pyplot as plt

from sklearn import datasets
from sklearn.decomposition import PCA
from sklearn.discriminant_analysis import LinearDiscriminantAnalysis

iris = datasets.load_iris()

X = iris.data
y = iris.target
target_names = iris.target_names

pca = PCA(n_components=2)
X_r = pca.fit(X).transform(X)

lda = LinearDiscriminantAnalysis(n_components=2)
X_r2 = lda.fit(X, y).transform(X)

# Percentage of variance explained for each components
print('explained variance ratio (first two components): %s'
      % str(pca.explained_variance_ratio_))

plt.figure()
colors = ['navy', 'turquoise', 'darkorange']
lw = 2

for color, i, target_name in zip(colors, [0, 1, 2], target_names):
    plt.scatter(X_r[y == i, 0], X_r[y == i, 1], color=color, alpha=.8, lw=lw,
                label=target_name)
plt.legend(loc='best', shadow=False, scatterpoints=1)
plt.title('PCA of IRIS dataset')

plt.figure()
for color, i, target_name in zip(colors, [0, 1, 2], target_names):
    plt.scatter(X_r2[y == i, 0], X_r2[y == i, 1], alpha=.8, color=color,
                label=target_name)
plt.legend(loc='best', shadow=False, scatterpoints=1)
plt.title('LDA of IRIS dataset')

plt.show()
腳本的總運行時間:(0分0.207秒)