IsolationForest示例?
一個使用 sklearn.ensemble.IsolationForest進行異常檢測的例子。
IsolationForest‘通過隨機選擇一個特征,然后在所選特征的最大值和最小值之間隨機選擇一個分割值來分離觀察。
由于遞歸劃分可以用樹結構表示,因此分離樣本所需的分割數相當于從根節點到終止節點的路徑長度。
這個路徑長度,在這樣隨機樹的森林的平均,是正常情況和我們的決策函數的一種度量。
隨機劃分產生明顯異常的較短路徑。因此,當隨機樹的森林對特定樣本產生較短的路徑長度時,它們很可能是異常。
print(__doc__)
import numpy as np
import matplotlib.pyplot as plt
from sklearn.ensemble import IsolationForest
rng = np.random.RandomState(42)
# Generate train data
X = 0.3 * rng.randn(100, 2)
X_train = np.r_[X + 2, X - 2]
# Generate some regular novel observations
X = 0.3 * rng.randn(20, 2)
X_test = np.r_[X + 2, X - 2]
# Generate some abnormal novel observations
X_outliers = rng.uniform(low=-4, high=4, size=(20, 2))
# fit the model
clf = IsolationForest(max_samples=100, random_state=rng)
clf.fit(X_train)
y_pred_train = clf.predict(X_train)
y_pred_test = clf.predict(X_test)
y_pred_outliers = clf.predict(X_outliers)
# plot the line, the samples, and the nearest vectors to the plane
xx, yy = np.meshgrid(np.linspace(-5, 5, 50), np.linspace(-5, 5, 50))
Z = clf.decision_function(np.c_[xx.ravel(), yy.ravel()])
Z = Z.reshape(xx.shape)
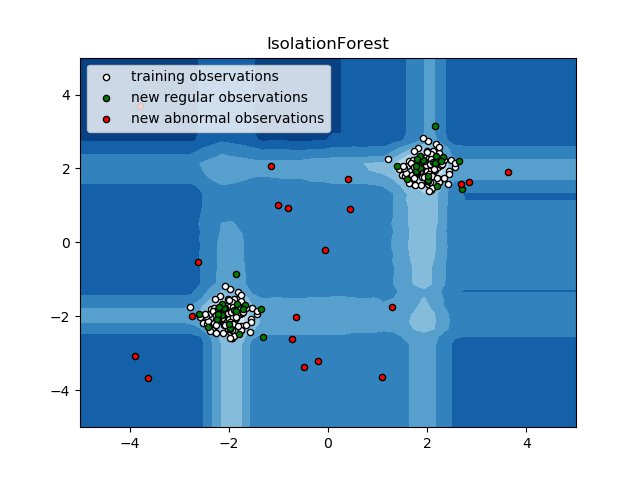
plt.title("IsolationForest")
plt.contourf(xx, yy, Z, cmap=plt.cm.Blues_r)
b1 = plt.scatter(X_train[:, 0], X_train[:, 1], c='white',
s=20, edgecolor='k')
b2 = plt.scatter(X_test[:, 0], X_test[:, 1], c='green',
s=20, edgecolor='k')
c = plt.scatter(X_outliers[:, 0], X_outliers[:, 1], c='red',
s=20, edgecolor='k')
plt.axis('tight')
plt.xlim((-5, 5))
plt.ylim((-5, 5))
plt.legend([b1, b2, c],
["training observations",
"new regular observations", "new abnormal observations"],
loc="upper left")
plt.show()
腳本的總運行時間:(0分0.495秒)