梯度提升正則?
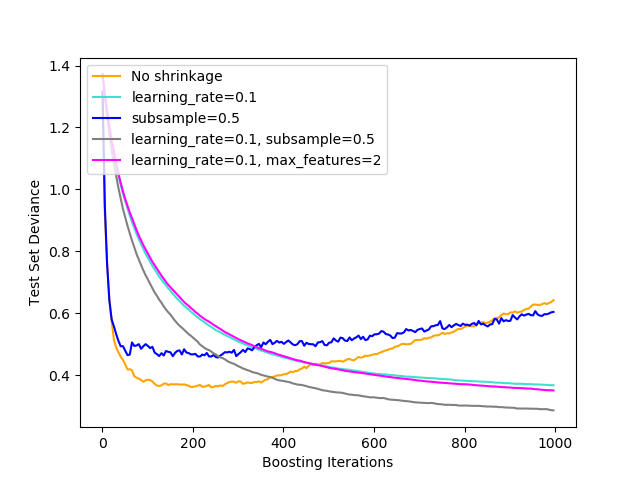
不同正則化策略對梯度提升效果的說明。這個例子來源于 Hastie et al 2009 [1]。
所使用的損失函數是二項偏差。通過收縮進行正則化(learning_rate < 1.0)大大提高了性能。結合收縮,隨機梯度提升 (subsample < 1.0)可以通過bagging降低方差來產生更精確的模型。不收縮的子采樣通常效果不佳。另一種降低方差的策略是對類似于隨機森林中的隨機分裂的特征進行子采樣(通過max_features參數)。
1 T. Hastie, R. Tibshirani and J. Friedman, “Elements of Statistical Learning Ed. 2”, Springer, 2009.
print(__doc__)

# Author: Peter Prettenhofer <peter.prettenhofer@gmail.com>
#
# License: BSD 3 clause

import numpy as np
import matplotlib.pyplot as plt

from sklearn import ensemble
from sklearn import datasets


X, y = datasets.make_hastie_10_2(n_samples=12000, random_state=1)
X = X.astype(np.float32)

# map labels from {-1, 1} to {0, 1}
labels, y = np.unique(y, return_inverse=True)

X_train, X_test = X[:2000], X[2000:]
y_train, y_test = y[:2000], y[2000:]

original_params = {'n_estimators': 1000, 'max_leaf_nodes': 4, 'max_depth': None, 'random_state': 2,
                   'min_samples_split': 5}

plt.figure()

for label, color, setting in [('No shrinkage', 'orange',
                               {'learning_rate': 1.0, 'subsample': 1.0}),
                              ('learning_rate=0.1', 'turquoise',
                               {'learning_rate': 0.1, 'subsample': 1.0}),
                              ('subsample=0.5', 'blue',
                               {'learning_rate': 1.0, 'subsample': 0.5}),
                              ('learning_rate=0.1, subsample=0.5', 'gray',
                               {'learning_rate': 0.1, 'subsample': 0.5}),
                              ('learning_rate=0.1, max_features=2', 'magenta',
                               {'learning_rate': 0.1, 'max_features': 2})]:
    params = dict(original_params)
    params.update(setting)

    clf = ensemble.GradientBoostingClassifier(**params)
    clf.fit(X_train, y_train)

    # compute test set deviance
    test_deviance = np.zeros((params['n_estimators'],), dtype=np.float64)

    for i, y_pred in enumerate(clf.staged_decision_function(X_test)):
        # clf.loss_ assumes that y_test[i] in {0, 1}
        test_deviance[i] = clf.loss_(y_test, y_pred)

    plt.plot((np.arange(test_deviance.shape[0]) + 1)[::5], test_deviance[::5],
            '-', color=color, label=label)

plt.legend(loc='upper left')
plt.xlabel('Boosting Iterations')
plt.ylabel('Test Set Deviance')

plt.show()
腳本的總運行時間:(0分27.859秒)
Download Python source code:plot_gradient_boosting_regularization.py
Download Jupyter notebook:plot_gradient_boosting_regularization.ipynb