隨機森林的OOB?
RandomForestClassifier的訓練是使用 bootstrap aggregation,其中每棵新的樹都是從訓練觀察中 bootstrap采樣的樣本進行訓練得來的。袋外誤差(out-of-bag (OOB) error), 它是每個的平均誤差, 的計算是來自于樹的預測, 但是這些樹的bootstrap樣本中并不包含。這允許RandomForestClassifier在訓練的時候能同時進行擬合和驗證。[1]
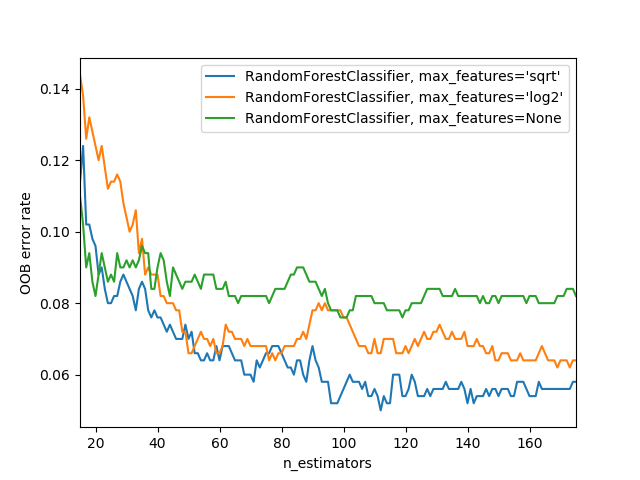
下面的示例演示如何在訓練期間增加每棵新樹時度量OOB誤差。
生成的圖允許參與者近似找到n_estimators的適當值,即該誤差穩定時。
1 T. Hastie, R. Tibshirani and J. Friedman, “Elements of Statistical Learning Ed. 2”, p592-593, Springer, 2009.
import matplotlib.pyplot as plt

from collections import OrderedDict
from sklearn.datasets import make_classification
from sklearn.ensemble import RandomForestClassifier

# Author: Kian Ho <hui.kian.ho@gmail.com>
#         Gilles Louppe <g.louppe@gmail.com>
#         Andreas Mueller <amueller@ais.uni-bonn.de>
#
# License: BSD 3 Clause

print(__doc__)

RANDOM_STATE = 123

# Generate a binary classification dataset.
X, y = make_classification(n_samples=500, n_features=25,
                           n_clusters_per_class=1, n_informative=15,
                           random_state=RANDOM_STATE)

# NOTE: Setting the `warm_start` construction parameter to `True` disables
# support for parallelized ensembles but is necessary for tracking the OOB
# error trajectory during training.
ensemble_clfs = [
    ("RandomForestClassifier, max_features='sqrt'",
        RandomForestClassifier(warm_start=True, oob_score=True,
                               max_features="sqrt",
                               random_state=RANDOM_STATE)),
    ("RandomForestClassifier, max_features='log2'",
        RandomForestClassifier(warm_start=True, max_features='log2',
                               oob_score=True,
                               random_state=RANDOM_STATE)),
    ("RandomForestClassifier, max_features=None",
        RandomForestClassifier(warm_start=True, max_features=None,
                               oob_score=True,
                               random_state=RANDOM_STATE))
]

# Map a classifier name to a list of (<n_estimators>, <error rate>) pairs.
error_rate = OrderedDict((label, []) for label, _ in ensemble_clfs)

# Range of `n_estimators` values to explore.
min_estimators = 15
max_estimators = 175

for label, clf in ensemble_clfs:
    for i in range(min_estimators, max_estimators + 1):
        clf.set_params(n_estimators=i)
        clf.fit(X, y)

        # Record the OOB error for each `n_estimators=i` setting.
        oob_error = 1 - clf.oob_score_
        error_rate[label].append((i, oob_error))

# Generate the "OOB error rate" vs. "n_estimators" plot.
for label, clf_err in error_rate.items():
    xs, ys = zip(*clf_err)
    plt.plot(xs, ys, label=label)

plt.xlim(min_estimators, max_estimators)
plt.xlabel("n_estimators")
plt.ylabel("OOB error rate")
plt.legend(loc="upper right")
plt.show()
腳本的總運行時間:(0分20.960秒)