梯度提升的提前停止?
梯度提升是一種集成技術,將幾個弱學習者(回歸樹)組合在一起,以迭代的方式生成一個強大的單一模型。
梯度提升中的早期停止支持使我們能夠找到最小的迭代次數,這足以建立一個可以很好地推廣到未知數據的模型。
早期停止的概念很簡單。我們指定了一個 validation_fraction ,它表示整個數據集的一小部分,該數據集將保留在訓練之外,以評估模型的驗證損失。梯度提升模型使用訓練集進行訓練,并使用驗證集進行評估。當每個增加階段增加上回歸樹時,將使用驗證集對模型進行評分。這個過程將持續到在最后的 n_iter_no_change 階段模型的評分沒有提高至少 tol為止。在此之后,該模型被認為已經收斂,進一步增加的階段是“提前停止”。
最終模型的提升數可在屬性n_estimators_中獲得。
這個例子說明了早期停止如何在sklearn.ensemble.GradientBoostingClassifier模型中被使用,與使用沒有早期停止的估計器建立的模型相比,達到幾乎相同的精度。這可以顯著減少訓練時間,內存使用和預測延遲。
# Authors: Vighnesh Birodkar <vighneshbirodkar@nyu.edu>
#          Raghav RV <rvraghav93@gmail.com>
# License: BSD 3 clause

import time

import numpy as np
import matplotlib.pyplot as plt

from sklearn import ensemble
from sklearn import datasets
from sklearn.model_selection import train_test_split

print(__doc__)

data_list = [datasets.load_iris(), datasets.load_digits()]
data_list = [(d.data, d.target) for d in data_list]
data_list += [datasets.make_hastie_10_2()]
names = ['Iris Data', 'Digits Data', 'Hastie Data']

n_gb = []
score_gb = []
time_gb = []
n_gbes = []
score_gbes = []
time_gbes = []

n_estimators = 500

for X, y in data_list:
    X_train, X_test, y_train, y_test = train_test_split(X, y, test_size=0.2,
                                                        random_state=0)

    # We specify that if the scores don't improve by atleast 0.01 for the last
    # 10 stages, stop fitting additional stages
    gbes = ensemble.GradientBoostingClassifier(n_estimators=n_estimators,
                                               validation_fraction=0.2,
                                               n_iter_no_change=5, tol=0.01,
                                               random_state=0)
    gb = ensemble.GradientBoostingClassifier(n_estimators=n_estimators,
                                             random_state=0)
    start = time.time()
    gb.fit(X_train, y_train)
    time_gb.append(time.time() - start)

    start = time.time()
    gbes.fit(X_train, y_train)
    time_gbes.append(time.time() - start)

    score_gb.append(gb.score(X_test, y_test))
    score_gbes.append(gbes.score(X_test, y_test))

    n_gb.append(gb.n_estimators_)
    n_gbes.append(gbes.n_estimators_)

bar_width = 0.2
n = len(data_list)
index = np.arange(0, n * bar_width, bar_width) * 2.5
index = index[0:n]
比較有無早期停止的得分
plt.figure(figsize=(9, 5))

bar1 = plt.bar(index, score_gb, bar_width, label='Without early stopping',
               color='crimson')
bar2 = plt.bar(index + bar_width, score_gbes, bar_width,
               label='With early stopping', color='coral')

plt.xticks(index + bar_width, names)
plt.yticks(np.arange(0, 1.3, 0.1))


def autolabel(rects, n_estimators):
    """
    Attach a text label above each bar displaying n_estimators of each model
    """
    for i, rect in enumerate(rects):
        plt.text(rect.get_x() + rect.get_width() / 2.,
                 1.05 * rect.get_height(), 'n_est=%d' % n_estimators[i],
                 ha='center', va='bottom')


autolabel(bar1, n_gb)
autolabel(bar2, n_gbes)

plt.ylim([0, 1.3])
plt.legend(loc='best')
plt.grid(True)

plt.xlabel('Datasets')
plt.ylabel('Test score')

plt.show()
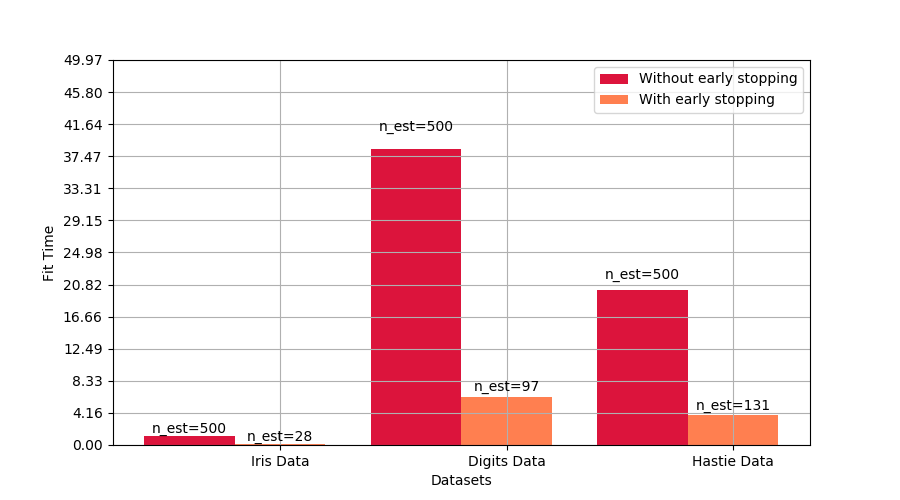
比較有無早期停止的擬合時間
plt.figure(figsize=(9, 5))

bar1 = plt.bar(index, time_gb, bar_width, label='Without early stopping',
               color='crimson')
bar2 = plt.bar(index + bar_width, time_gbes, bar_width,
               label='With early stopping', color='coral')

max_y = np.amax(np.maximum(time_gb, time_gbes))

plt.xticks(index + bar_width, names)
plt.yticks(np.linspace(0, 1.3 * max_y, 13))

autolabel(bar1, n_gb)
autolabel(bar2, n_gbes)

plt.ylim([0, 1.3 * max_y])
plt.legend(loc='best')
plt.grid(True)

plt.xlabel('Datasets')
plt.ylabel('Fit Time')

plt.show()
 腳本的總運行時間:(1分10.353秒)
Download Python source code:plot_gradient_boosting_early_stopping.py
Download Jupyter notebook:plot_gradient_boosting_early_stopping.ipynb