離散數據結構上的高斯過程?
此示例說明如何使用高斯過程對非固定長度特征向量形式的數據進行回歸和分類任務。這是通過核函數在離散結構(例如可變長度序列、樹和圖)直接操作實現的。
具體來說,這里的輸入變量是一些以可變長度字符串形式存儲的由字母‘A’、‘T’、‘C’和‘G’組成的基因序列,而在回歸和分類任務中,輸出變量分別是浮點數和真/假標簽。
基因序列之間的核是用R-convolution[1]定義的,它是通過在一對字符串之間的所有字母對上集成一個二進制字母級核來定義的。
此示例將生成三個圖。
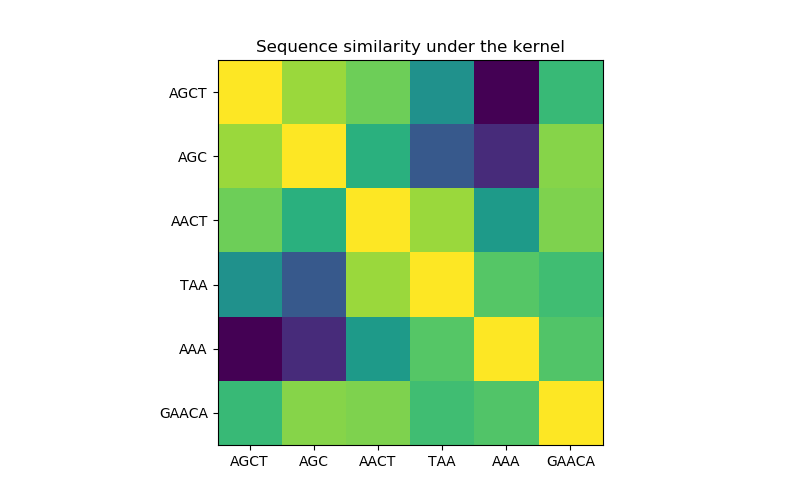
在第一個圖中,我們使用顏色映射來可視化內核的值,即序列的相似性。這里較亮的顏色表示更高的相似性。
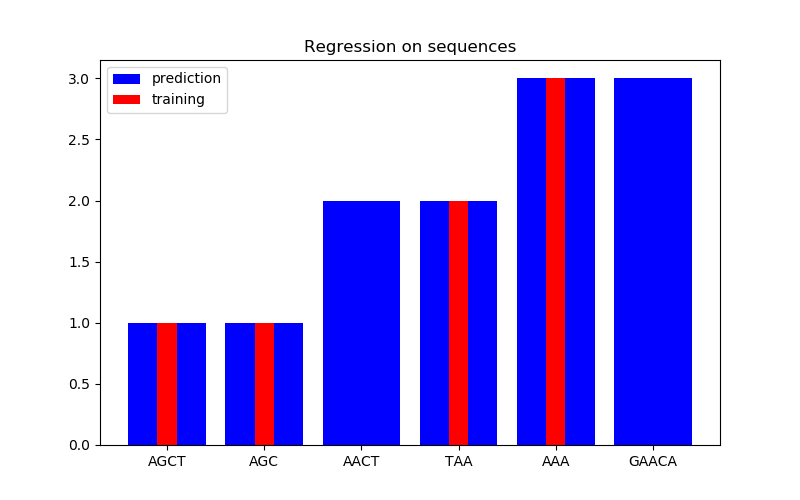
在第二個圖中,我們在6個序列的數據集上給出了一些回歸結果。這里我們使用第一、第二、第四和第五序列作為訓練集,對第三和第六序列進行預測。
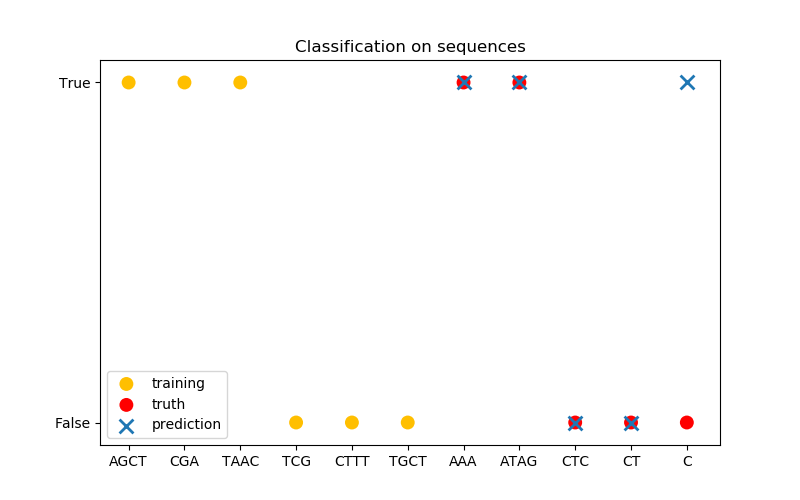
在第三張圖中,我們通過對6序列進行訓練來演示一個分類模型,并對另外5個序列進行預測。這里的基本事實是,序列中至少有一個‘A’。在這里,模型進行了四種正確的分類,其中一種分類失敗。
1 Haussler, D. (1999). Convolution kernels on discrete structures (Vol. 646). Technical report, Department of Computer Science, University of California at Santa Cruz.
print(__doc__)

import numpy as np
import matplotlib.pyplot as plt
from sklearn.gaussian_process.kernels import Kernel, Hyperparameter
from sklearn.gaussian_process.kernels import GenericKernelMixin
from sklearn.gaussian_process import GaussianProcessRegressor
from sklearn.gaussian_process import GaussianProcessClassifier
from sklearn.base import clone


class SequenceKernel(GenericKernelMixin, Kernel):
    '''
    A minimal (but valid) convolutional kernel for sequences of variable
    lengths.'''
    def __init__(self,
                 baseline_similarity=0.5,
                 baseline_similarity_bounds=(1e-5, 1)):
        self.baseline_similarity = baseline_similarity
        self.baseline_similarity_bounds = baseline_similarity_bounds

    @property
    def hyperparameter_baseline_similarity(self):
        return Hyperparameter("baseline_similarity",
                              "numeric",
                              self.baseline_similarity_bounds)

    def _f(self, s1, s2):
        '''
        kernel value between a pair of sequences
        '''
        return sum([1.0 if c1 == c2 else self.baseline_similarity
                   for c1 in s1
                   for c2 in s2])

    def _g(self, s1, s2):
        '''
        kernel derivative between a pair of sequences
        '''
        return sum([0.0 if c1 == c2 else 1.0
                    for c1 in s1
                    for c2 in s2])

    def __call__(self, X, Y=None, eval_gradient=False):
        if Y is None:
            Y = X

        if eval_gradient:
            return (np.array([[self._f(x, y) for y in Y] for x in X]),
                    np.array([[[self._g(x, y)] for y in Y] for x in X]))
        else:
            return np.array([[self._f(x, y) for y in Y] for x in X])

    def diag(self, X):
        return np.array([self._f(x, x) for x in X])

    def is_stationary(self):
        return False

    def clone_with_theta(self, theta):
        cloned = clone(self)
        cloned.theta = theta
        return cloned


kernel = SequenceKernel()

'''
Sequence similarity matrix under the kernel
===========================================
'''

X = np.array(['AGCT', 'AGC', 'AACT', 'TAA', 'AAA', 'GAACA'])

K = kernel(X)
D = kernel.diag(X)

plt.figure(figsize=(8, 5))
plt.imshow(np.diag(D**-0.5).dot(K).dot(np.diag(D**-0.5)))
plt.xticks(np.arange(len(X)), X)
plt.yticks(np.arange(len(X)), X)
plt.title('Sequence similarity under the kernel')

'''
Regression
==========
'''

X = np.array(['AGCT', 'AGC', 'AACT', 'TAA', 'AAA', 'GAACA'])
Y = np.array([1.0, 1.0, 2.0, 2.0, 3.0, 3.0])

training_idx = [0, 1, 3, 4]
gp = GaussianProcessRegressor(kernel=kernel)
gp.fit(X[training_idx], Y[training_idx])

plt.figure(figsize=(8, 5))
plt.bar(np.arange(len(X)), gp.predict(X), color='b', label='prediction')
plt.bar(training_idx, Y[training_idx], width=0.2, color='r',
        alpha=1, label='training')
plt.xticks(np.arange(len(X)), X)
plt.title('Regression on sequences')
plt.legend()

'''
Classification
==============
'''

X_train = np.array(['AGCT', 'CGA', 'TAAC', 'TCG', 'CTTT', 'TGCT'])
# whether there are 'A's in the sequence
Y_train = np.array([True, True, True, False, False, False])

gp = GaussianProcessClassifier(kernel)
gp.fit(X_train, Y_train)

X_test = ['AAA', 'ATAG', 'CTC', 'CT', 'C']
Y_test = [True, True, False, False, False]

plt.figure(figsize=(8, 5))
plt.scatter(np.arange(len(X_train)), [1.0 if c else -1.0 for c in Y_train],
            s=100, marker='o', edgecolor='none', facecolor=(1, 0.75, 0),
            label='training')
plt.scatter(len(X_train) + np.arange(len(X_test)),
            [1.0 if c else -1.0 for c in Y_test],
            s=100, marker='o', edgecolor='none', facecolor='r', label='truth')
plt.scatter(len(X_train) + np.arange(len(X_test)),
            [1.0 if c else -1.0 for c in gp.predict(X_test)],
            s=100, marker='x', edgecolor=(0, 1.0, 0.3), linewidth=2,
            label='prediction')
plt.xticks(np.arange(len(X_train) + len(X_test)),
           np.concatenate((X_train, X_test)))
plt.yticks([-1, 1], [False, True])
plt.title('Classification on sequences')
plt.legend()

plt.show()
腳本的總運行時間:(0分0.260秒)
Download Python source code: plot_gpr_on_structured_data.py
Download Jupyter notebook: plot_gpr_on_structured_data.ipynb