手寫數據集上的標簽傳播:性能展示?
本示例通過訓練標簽擴展模型來用很少的標簽集對手寫數字進行分類,展示了半監督學習的能力。
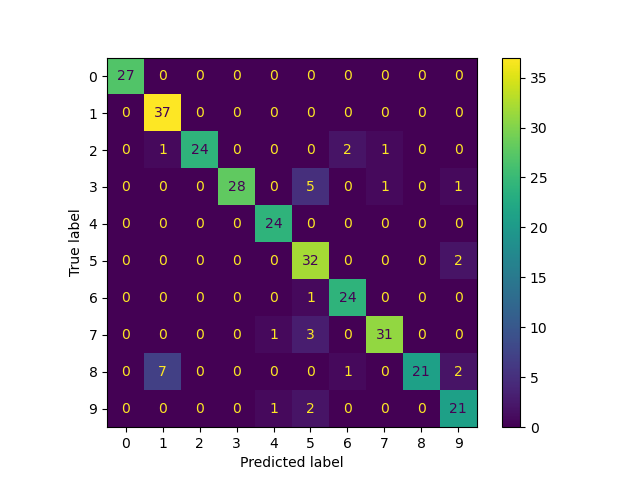
手寫數字數據集共有1797個點。 該模型將使用所有點進行訓練,但僅會標記30個點。 以混淆矩陣和一系列關于每個類的度量的形式的結果將是非常好的。
最后,將顯示前10個最不確定的預測。
print(__doc__)

# 作者: Clay Woolam <clay@woolam.org>
# 執照: BSD

import numpy as np
import matplotlib.pyplot as plt

from scipy import stats

from sklearn import datasets
from sklearn.semi_supervised import LabelSpreading

from sklearn.metrics import confusion_matrix, classification_report

digits = datasets.load_digits()
rng = np.random.RandomState(2)
indices = np.arange(len(digits.data))
rng.shuffle(indices)

X = digits.data[indices[:340]]
y = digits.target[indices[:340]]
images = digits.images[indices[:340]]

n_total_samples = len(y)
n_labeled_points = 40

indices = np.arange(n_total_samples)

unlabeled_set = indices[n_labeled_points:]

# #############################################################################
# 每一輪都打亂順序
y_train = np.copy(y)
y_train[unlabeled_set] = -1

# #############################################################################
# 通過LabelSpreading進行學習
lp_model = LabelSpreading(gamma=.25, max_iter=20)
lp_model.fit(X, y_train)
predicted_labels = lp_model.transduction_[unlabeled_set]
true_labels = y[unlabeled_set]

cm = confusion_matrix(true_labels, predicted_labels, labels=lp_model.classes_)

print("Label Spreading model: %d labeled & %d unlabeled points (%d total)" %
      (n_labeled_points, n_total_samples - n_labeled_points, n_total_samples))

print(classification_report(true_labels, predicted_labels))

print("Confusion matrix")
print(cm)

# #############################################################################
# 計算每個轉換分布的不確定性值
pred_entropies = stats.distributions.entropy(lp_model.label_distributions_.T)

# #############################################################################
# 選擇十大最不確定的標簽
uncertainty_index = np.argsort(pred_entropies)[-10:]

# #############################################################################
# 繪圖
f = plt.figure(figsize=(7, 5))
for index, image_index in enumerate(uncertainty_index):
    image = images[image_index]

    sub = f.add_subplot(2, 5, index + 1)
    sub.imshow(image, cmap=plt.cm.gray_r)
    plt.xticks([])
    plt.yticks([])
    sub.set_title('predict: %i\ntrue: %i' % (
        lp_model.transduction_[image_index], y[image_index]))

f.suptitle('Learning with small amount of labeled data')
輸出:
Label Spreading model: 40 labeled & 300 unlabeled points (340 total)
              precision    recall  f1-score   support

           0       1.00      1.00      1.00        27
           1       0.82      1.00      0.90        37
           2       1.00      0.86      0.92        28
           3       1.00      0.80      0.89        35
           4       0.92      1.00      0.96        24
           5       0.74      0.94      0.83        34
           6       0.89      0.96      0.92        25
           7       0.94      0.89      0.91        35
           8       1.00      0.68      0.81        31
           9       0.81      0.88      0.84        24

    accuracy                           0.90       300
   macro avg       0.91      0.90      0.90       300
weighted avg       0.91      0.90      0.90       300

Confusion matrix
[[27  0  0  0  0  0  0  0  0  0]
 [ 0 37  0  0  0  0  0  0  0  0]
 [ 0  1 24  0  0  0  2  1  0  0]
 [ 0  0  0 28  0  5  0  1  0  1]
 [ 0  0  0  0 24  0  0  0  0  0]
 [ 0  0  0  0  0 32  0  0  0  2]
 [ 0  0  0  0  0  1 24  0  0  0]
 [ 0  0  0  0  1  3  0 31  0  0]
 [ 0  7  0  0  0  0  1  0 21  2]
 [ 0  0  0  0  1  2  0  0  0 21]]
腳本的總運行時間:0分鐘0.318秒