SVM-Anova:具有單變量特征選擇的SVM?
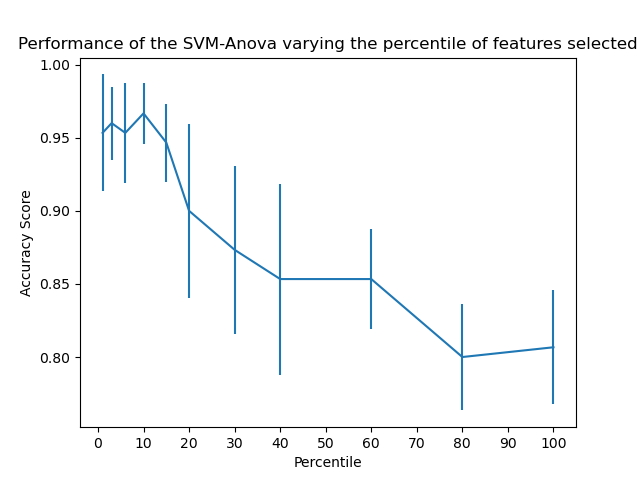
本案例說明如何在運行SVC(支持向量分類器)以改善分類評分之前執行單變量特征選擇。 我們使用鳶尾花數據集(4個特征)并添加36個非信息特征。我們發現,當我們選擇大約10%的特征時,我們的模型將獲得最佳性能。
輸入:
print(__doc__)

import numpy as np
import matplotlib.pyplot as plt
from sklearn.datasets import load_iris
from sklearn.feature_selection import SelectPercentile, chi2
from sklearn.model_selection import cross_val_score
from sklearn.pipeline import Pipeline
from sklearn.preprocessing import StandardScaler
from sklearn.svm import SVC


# #############################################################################
# 導入數據以備后續處理
X, y = load_iris(return_X_y=True)
# 增加非信息特征
np.random.seed(0)
X = np.hstack((X, 2 * np.random.random((X.shape[0], 36))))

# #############################################################################
# 創建一個特征選擇變換類,一個標準化類和一個SVM實例,我們將它們組合在一起以得到一個成熟的估算器
clf = Pipeline([('anova', SelectPercentile(chi2)),
                ('scaler', StandardScaler()),
                ('svc', SVC(gamma="auto"))])

# #############################################################################
# 將交叉驗證得分繪制為特征百分位數的函數
score_means = list()
score_stds = list()
percentiles = (1, 3, 6, 10, 15, 20, 30, 40, 60, 80, 100)

for percentile in percentiles:
    clf.set_params(anova__percentile=percentile)
    this_scores = cross_val_score(clf, X, y)
    score_means.append(this_scores.mean())
    score_stds.append(this_scores.std())

plt.errorbar(percentiles, score_means, np.array(score_stds))
plt.title(
    'Performance of the SVM-Anova varying the percentile of features selected')
plt.xticks(np.linspace(0, 100, 11, endpoint=True))
plt.xlabel('Percentile')
plt.ylabel('Accuracy Score')
plt.axis('tight')
plt.show()
腳本的總運行時間:(0分鐘0.358秒)