糖尿病數據集上的交叉驗證練習?
使用線性模型交叉驗證的教程練習。
本練習在“模型選擇”的“交叉驗證的估計器”部分中使用:《科學數據處理的統計學習指南》的“選擇估計器及其參數”部分。
print(__doc__)
import numpy as np
import matplotlib.pyplot as plt
from sklearn import datasets
from sklearn.linear_model import LassoCV
from sklearn.linear_model import Lasso
from sklearn.model_selection import KFold
from sklearn.model_selection import GridSearchCV
X, y = datasets.load_diabetes(return_X_y=True)
X = X[:150]
y = y[:150]
lasso = Lasso(random_state=0, max_iter=10000)
alphas = np.logspace(-4, -0.5, 30)
tuned_parameters = [{'alpha': alphas}]
n_folds = 5
clf = GridSearchCV(lasso, tuned_parameters, cv=n_folds, refit=False)
clf.fit(X, y)
scores = clf.cv_results_['mean_test_score']
scores_std = clf.cv_results_['std_test_score']
plt.figure().set_size_inches(8, 6)
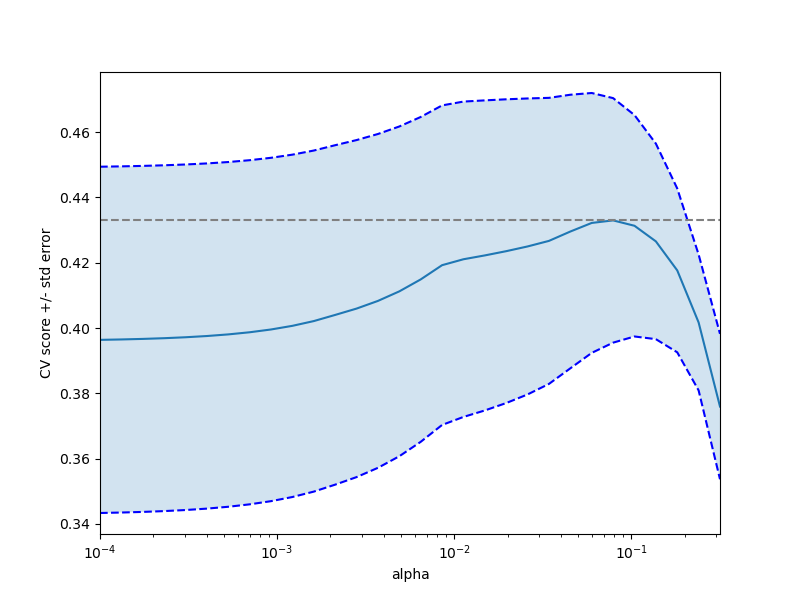
plt.semilogx(alphas, scores)
# 顯示誤差線,顯示+/-標準。 分數錯誤
std_error = scores_std / np.sqrt(n_folds)
plt.semilogx(alphas, scores + std_error, 'b--')
plt.semilogx(alphas, scores - std_error, 'b--')
# alpha = 0.2控制填充顏色的半透明性
plt.fill_between(alphas, scores + std_error, scores - std_error, alpha=0.2)
plt.ylabel('CV score +/- std error')
plt.xlabel('alpha')
plt.axhline(np.max(scores), linestyle='--', color='.5')
plt.xlim([alphas[0], alphas[-1]])
# #############################################################################
# 獎勵:您對alpha的選擇結果有多少信心呢?
'''
為了回答這個問題,我們使用了LassoCV對象,該對象通過內部交叉驗證自動從數據中設置其alpha參數(即,它對收到的訓練數據執行交叉驗證)。
我們使用外部交叉驗證來查看自動獲得的字母在不同交叉驗證折痕之間的差異。
'''
lasso_cv = LassoCV(alphas=alphas, random_state=0, max_iter=10000)
k_fold = KFold(3)
print("Answer to the bonus question:",
"how much can you trust the selection of alpha?")
print()
print("Alpha parameters maximising the generalization score on different")
print("subsets of the data:")
for k, (train, test) in enumerate(k_fold.split(X, y)):
lasso_cv.fit(X[train], y[train])
print("[fold {0}] alpha: {1:.5f}, score: {2:.5f}".
format(k, lasso_cv.alpha_, lasso_cv.score(X[test], y[test])))
print()
print("Answer: Not very much since we obtained different alphas for different")
print("subsets of the data and moreover, the scores for these alphas differ")
print("quite substantially.")
plt.show()
輸出:
Answer to the bonus question: how much can you trust the selection of alpha?

Alpha parameters maximising the generalization score on different
subsets of the data:
[fold 0] alpha: 0.05968, score: 0.54209
[fold 1] alpha: 0.04520, score: 0.15523
[fold 2] alpha: 0.07880, score: 0.45193

Answer: Not very much since we obtained different alphas for different
subsets of the data and moreover, the scores for these alphas differ
quite substantially.
腳本的總運行時間:(0分鐘0.649 秒)