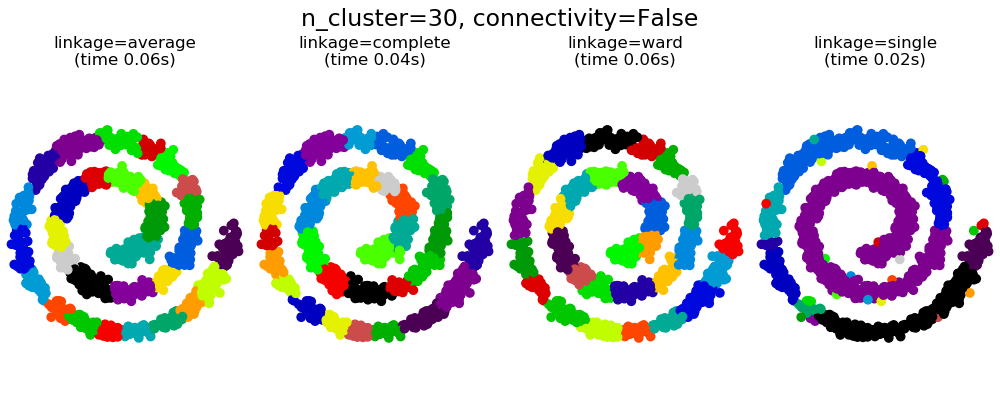
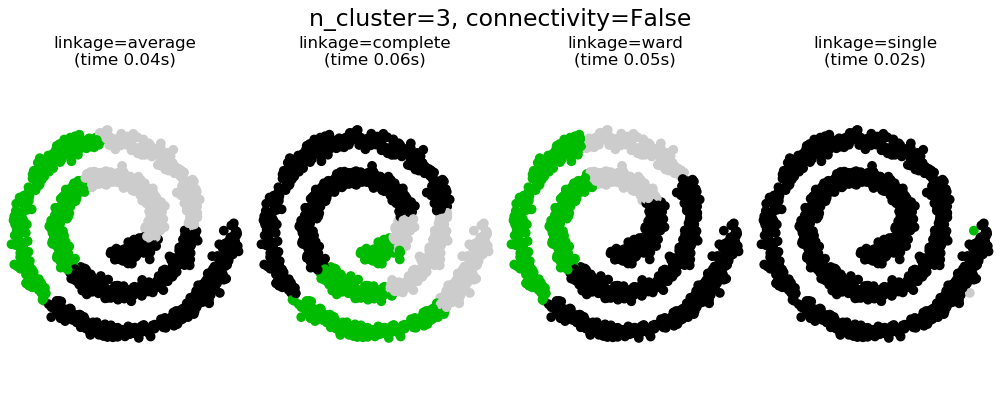
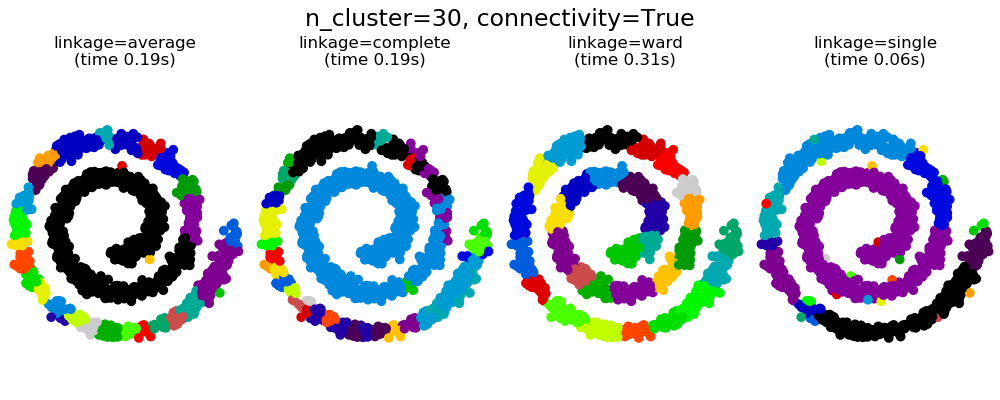
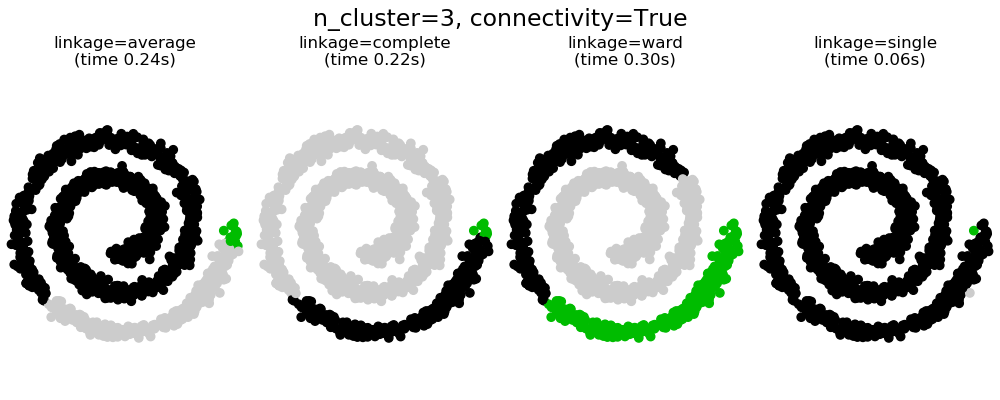
帶結構和無結構的凝聚聚類?
此示例顯示了強制設置連接圖以捕獲數據中的本地結構的效果。這張圖就是20個最近鄰的圖。
可以看到強制連接的兩個結果。第一個有連接矩陣的聚類要快的多。
第二,當使用一個連接矩陣時,單個、平均和完全的聯系是不穩定的,并且傾向于創建一些增長非常快的聚類。實際上,平均和完全鏈接通過在合并時考慮兩個聚類之間的所有距離來對抗這種滲流行為(而單個鏈接只考慮聚類之間的最短距離,從而夸大了它們的行為)。連接圖破壞了平均和完整的連接機制,使它們類似于更脆弱的單連桿。這種影響對于非常稀疏的圖(嘗試減少k-鄰域圖中的鄰居數)和完全鏈接的效果更為明顯。特別是,在圖中有非常少的鄰居,施加一個接近單一連桿的幾何學,這種幾何學是眾所周知的有這種滲流不穩定性。
# Authors: Gael Varoquaux, Nelle Varoquaux
# License: BSD 3 clause

import time
import matplotlib.pyplot as plt
import numpy as np

from sklearn.cluster import AgglomerativeClustering
from sklearn.neighbors import kneighbors_graph

# Generate sample data
n_samples = 1500
np.random.seed(0)
t = 1.5 * np.pi * (1 + 3 * np.random.rand(1, n_samples))
x = t * np.cos(t)
y = t * np.sin(t)


X = np.concatenate((x, y))
X += .7 * np.random.randn(2, n_samples)
X = X.T

# Create a graph capturing local connectivity. Larger number of neighbors
# will give more homogeneous clusters to the cost of computation
# time. A very large number of neighbors gives more evenly distributed
# cluster sizes, but may not impose the local manifold structure of
# the data
knn_graph = kneighbors_graph(X, 30, include_self=False)

for connectivity in (None, knn_graph):
    for n_clusters in (30, 3):
        plt.figure(figsize=(10, 4))
        for index, linkage in enumerate(('average',
                                         'complete',
                                         'ward',
                                         'single')):
            plt.subplot(1, 4, index + 1)
            model = AgglomerativeClustering(linkage=linkage,
                                            connectivity=connectivity,
                                            n_clusters=n_clusters)
            t0 = time.time()
            model.fit(X)
            elapsed_time = time.time() - t0
            plt.scatter(X[:, 0], X[:, 1], c=model.labels_,
                        cmap=plt.cm.nipy_spectral)
            plt.title('linkage=%s\n(time %.2fs)' % (linkage, elapsed_time),
                      fontdict=dict(verticalalignment='top'))
            plt.axis('equal')
            plt.axis('off')

            plt.subplots_adjust(bottom=0, top=.83, wspace=0,
                                left=0, right=1)
            plt.suptitle('n_cluster=%i, connectivity=%r' %
                         (n_clusters, connectivity is not None), size=17)


plt.show()
腳本的總運行時間:(0分3.048秒)
Download Python source code:plot_agglomerative_clustering.py
Download Jupyter notebook:plot_agglomerative_clustering.ipynb