光譜聚類在圖像分割中的應用?
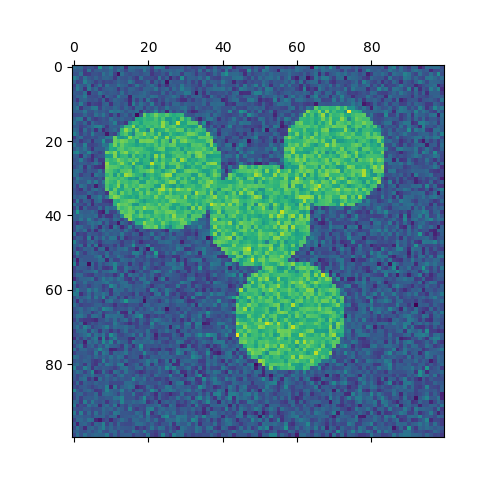
在此示例中,生成了具有連通圓的圖像,并使用光譜聚類方法將圓分離。
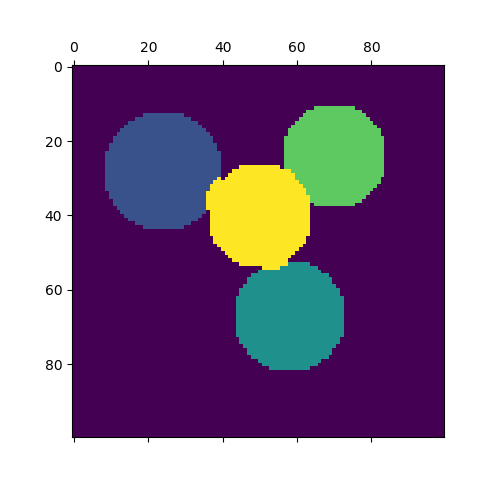
在這種情況下,光譜聚類方法解決了所謂的“‘normalized graph cuts’”問題:將圖像看作是連通體素圖,而光譜聚類算法則是選擇圖切分定義區域,同時最小化割集的梯度比率和區域體積。
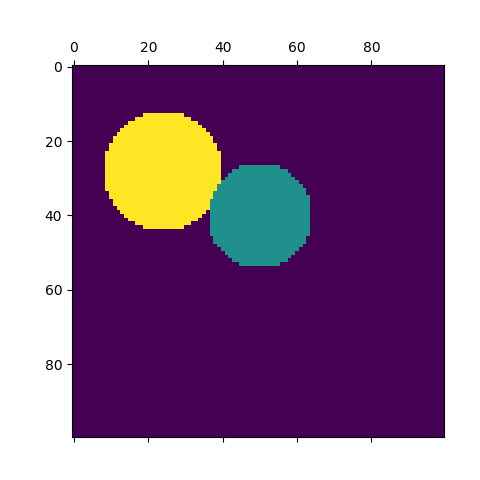
當算法試圖平衡體積(即平衡區域大小)時,如果采用不同大小的圓圈,則分割失敗。
此外,由于圖像的灰度或梯度中沒有有用的信息,我們選擇在只有弱梯度信息的圖上進行光譜聚類。這接近于執行圖的Voronoi分割。
此外,我們使用對象的掩碼將圖形限制在對象的輪廓上。在本例中,我們感興趣的是將對象從一個對象和另一個對象中分離出來,而不是從背景中分離出來。
print(__doc__)
# Authors: Emmanuelle Gouillart <emmanuelle.gouillart@normalesup.org>
# Gael Varoquaux <gael.varoquaux@normalesup.org>
# License: BSD 3 clause
import numpy as np
import matplotlib.pyplot as plt
from sklearn.feature_extraction import image
from sklearn.cluster import spectral_clustering
l = 100
x, y = np.indices((l, l))
center1 = (28, 24)
center2 = (40, 50)
center3 = (67, 58)
center4 = (24, 70)
radius1, radius2, radius3, radius4 = 16, 14, 15, 14
circle1 = (x - center1[0]) ** 2 + (y - center1[1]) ** 2 < radius1 ** 2
circle2 = (x - center2[0]) ** 2 + (y - center2[1]) ** 2 < radius2 ** 2
circle3 = (x - center3[0]) ** 2 + (y - center3[1]) ** 2 < radius3 ** 2
circle4 = (x - center4[0]) ** 2 + (y - center4[1]) ** 2 < radius4 ** 2
# #############################################################################
# 4 circles
img = circle1 + circle2 + circle3 + circle4
# We use a mask that limits to the foreground: the problem that we are
# interested in here is not separating the objects from the background,
# but separating them one from the other.
mask = img.astype(bool)
img = img.astype(float)
img += 1 + 0.2 * np.random.randn(*img.shape)
# Convert the image into a graph with the value of the gradient on the
# edges.
graph = image.img_to_graph(img, mask=mask)
# Take a decreasing function of the gradient: we take it weakly
# dependent from the gradient the segmentation is close to a voronoi
graph.data = np.exp(-graph.data / graph.data.std())
# Force the solver to be arpack, since amg is numerically
# unstable on this example
labels = spectral_clustering(graph, n_clusters=4, eigen_solver='arpack')
label_im = np.full(mask.shape, -1.)
label_im[mask] = labels
plt.matshow(img)
plt.matshow(label_im)
# #############################################################################
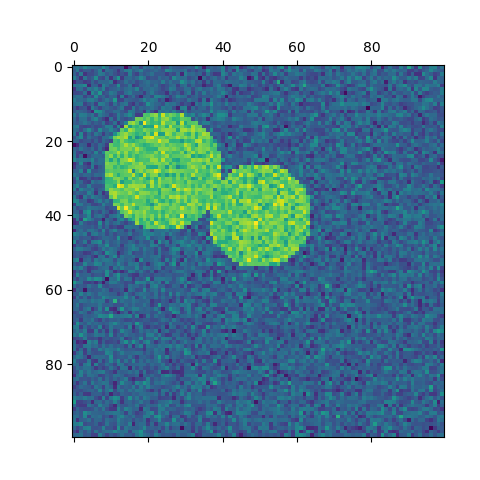
# 2 circles
img = circle1 + circle2
mask = img.astype(bool)
img = img.astype(float)
img += 1 + 0.2 * np.random.randn(*img.shape)
graph = image.img_to_graph(img, mask=mask)
graph.data = np.exp(-graph.data / graph.data.std())
labels = spectral_clustering(graph, n_clusters=2, eigen_solver='arpack')
label_im = np.full(mask.shape, -1.)
label_im[mask] = labels
plt.matshow(img)
plt.matshow(label_im)
plt.show()
腳本的總運行時間:(0分0.721秒)