局部依賴的高級繪圖?
plot_partial_dependence函數返回一個PartialDependenceDisplay對象,該對象可用于繪圖而無需重新計算部分依賴關系(partial dependency)。 在此示例中,我們顯示了如何繪制部分依賴圖以及如何使用可視化API快速自定義圖。
注意:另請參見帶有可視化API的ROC曲線
print(__doc__)

import pandas as pd
import matplotlib.pyplot as plt
from sklearn.datasets import load_diabetes
from sklearn.neural_network import MLPRegressor
from sklearn.preprocessing import StandardScaler
from sklearn.pipeline import make_pipeline
from sklearn.tree import DecisionTreeRegressor
from sklearn.inspection import plot_partial_dependence
在糖尿病數據集上訓練數據
首先,我們在糖尿病數據集上訓練決策樹和多層感知機。
diabetes = load_diabetes()
X = pd.DataFrame(diabetes.data, columns=diabetes.feature_names)
y = diabetes.target
tree = DecisionTreeRegressor()
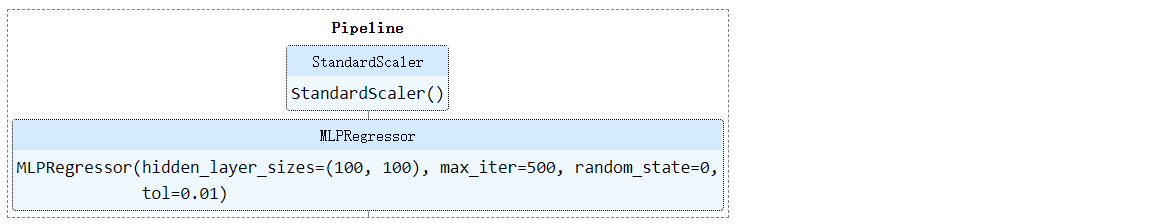
mlp = make_pipeline(StandardScaler(),
MLPRegressor(hidden_layer_sizes=(100, 100),
tol=1e-2, max_iter=500, random_state=0))
tree.fit(X, y)
mlp.fit(X, y)
輸出:
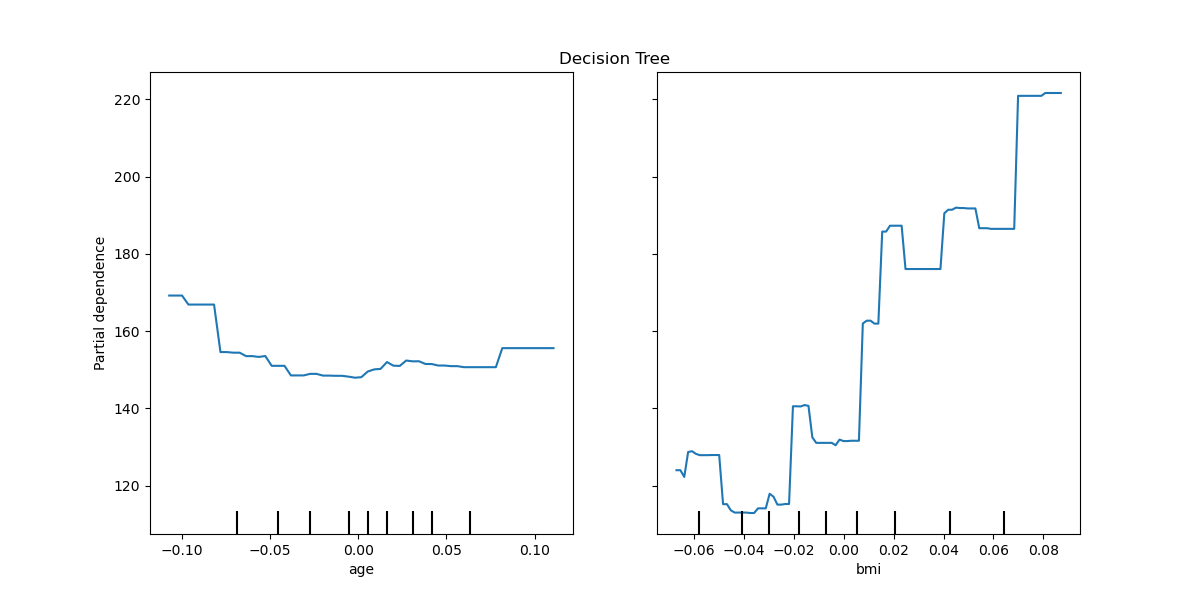
繪制兩個特征的部分相關性
我們為決策樹的“年齡”和“ bmi”(體重指數)特征繪制了部分依賴曲線。 具有兩個功能,plot_partial_dependence期望繪制兩條曲線。 這里的plot函數使用ax定義的空間放置兩個圖的網格。
fig, ax = plt.subplots(figsize=(12, 6))
ax.set_title("Decision Tree")
tree_disp = plot_partial_dependence(tree, X, ["age", "bmi"], ax=ax)
輸出:
/home/circleci/project/sklearn/tree/_classes.py:1254: FutureWarning: the classes_ attribute is to be deprecated from version 0.22 and will be removed in 0.24.
  warnings.warn(msg, FutureWarning)
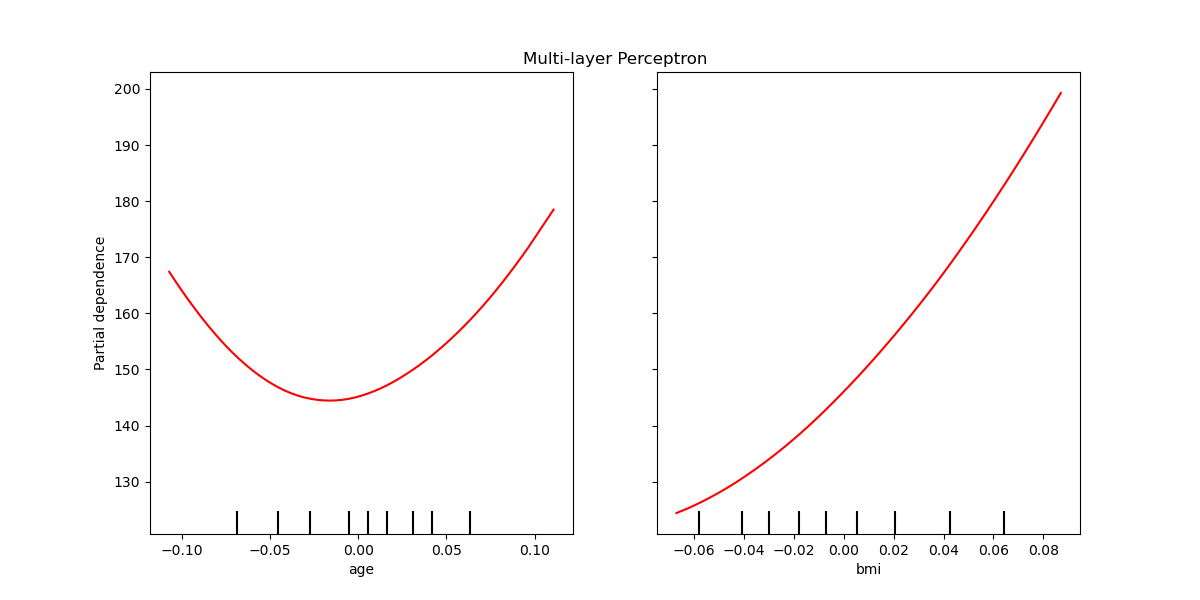
可以為多層感知機繪制部分依賴曲線。 在這種情況下,將line_kw傳遞給plot_partial_dependence以更改曲線的顏色。
fig, ax = plt.subplots(figsize=(12, 6))
ax.set_title("Multi-layer Perceptron")
mlp_disp = plot_partial_dependence(mlp, X, ["age", "bmi"], ax=ax,
                                   line_kw={"c": "red"})
一起繪制兩個模型的部分依賴性
tree_disp和mlp_disp PartialDependenceDisplay對象包含重新創建部分依賴曲線所需的所有計算信息。 這意味著我們可以輕松創建其他圖,而無需重新計算曲線。
繪制曲線的一種方法是將它們放置在同一圖形中,每個模型的曲線在每一行上。 首先,我們創建一個在兩行一列中具有兩個軸的圖形。 這兩個軸傳遞給tree_disp和mlp_disp的繪圖函數。 繪圖功能將使用給定的軸來繪制部分相關性。 結果圖將決策樹部分相關曲線放置在第二行的多層感知器的第一行中。
fig, (ax1, ax2) = plt.subplots(2, 1, figsize=(10, 10))
tree_disp.plot(ax=ax1)
ax1.set_title("Decision Tree")
mlp_disp.plot(ax=ax2, line_kw={"c": "red"})
ax2.set_title("Multi-layer Perceptron")
輸出:

Text(0.5, 1.0, 'Multi-layer Perceptron')
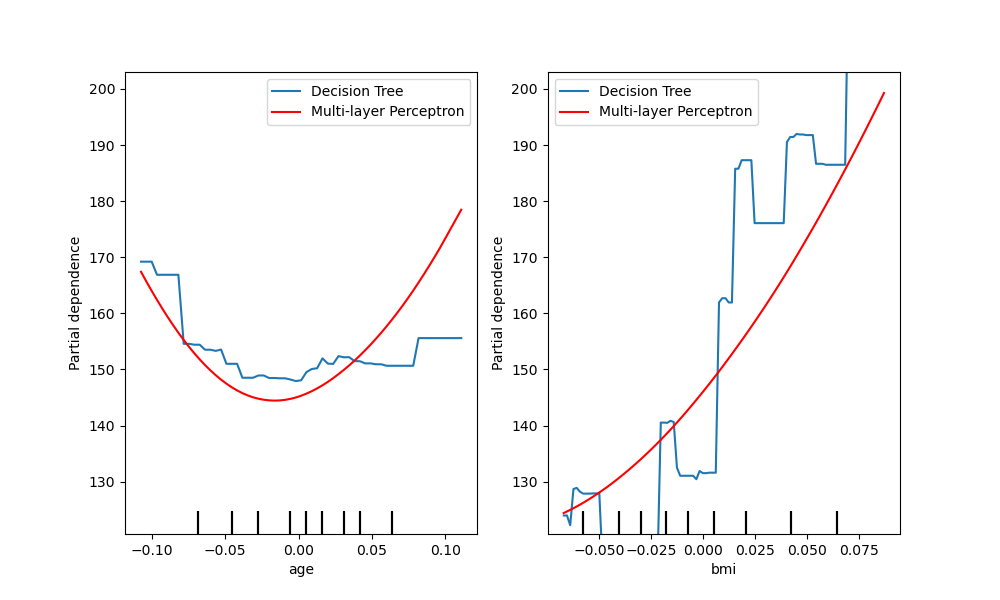
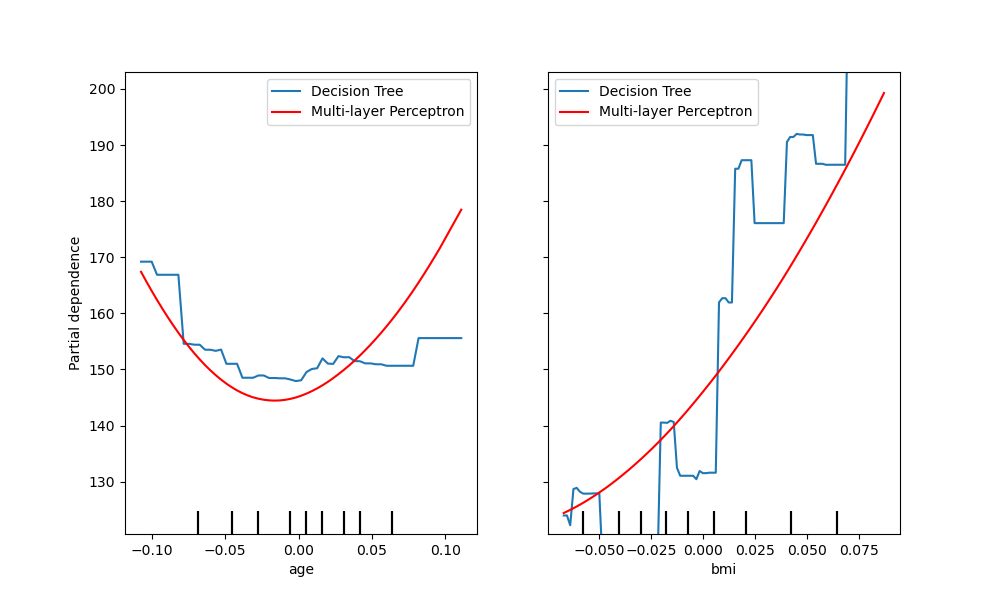
比較曲線的另一種方法是將它們繪制在彼此的頂部。 在這里,我們創建一個具有一行和兩列的圖形。 軸作為列表傳遞到繪圖函數中,該列表將在同一軸上繪制每個模型的部分依賴性曲線。 軸列表的長度必須等于繪制的圖數。
fig, (ax1, ax2) = plt.subplots(1, 2, figsize=(10, 6))
tree_disp.plot(ax=[ax1, ax2], line_kw={"label": "Decision Tree"})
mlp_disp.plot(ax=[ax1, ax2], line_kw={"label": "Multi-layer Perceptron",
                                      "c": "red"})
ax1.legend()
ax2.legend()
輸出:
<matplotlib.legend.Legend object at 0x7f9606d26d00>
tree_disp.axes_是一個numpy數組容器,其軸用于繪制部分依賴圖,可以將其傳遞給mlp_disp以產生將圖相互疊加繪制的相同效果。 此外,mlp_disp.figure_存儲圖形,這允許在調用圖后調整圖形的大小。 在這種情況下tree_disp.axes_具有兩個維度,因此圖將僅在最左側的圖上顯示y標簽和y刻度。
tree_disp.plot(line_kw={"label": "Decision Tree"})
mlp_disp.plot(line_kw={"label": "Multi-layer Perceptron", "c": "red"},
              ax=tree_disp.axes_)
tree_disp.figure_.set_size_inches(10, 6)
tree_disp.axes_[0, 0].legend()
tree_disp.axes_[0, 1].legend()
plt.show()
輸出:
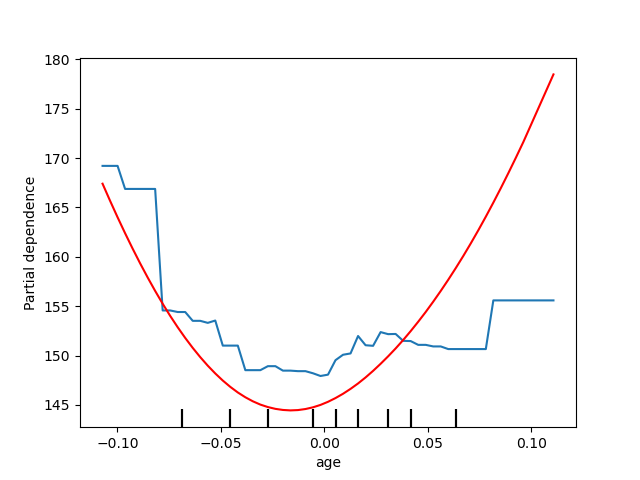
繪制一個特征的部分依賴關系
在這里,我們在同一根軸上繪制單個特征“年齡”的部分依賴曲線。 在這種情況下,tree_disp.axes_被傳遞到第二個繪圖函數中。
tree_disp = plot_partial_dependence(tree, X, ["age"])
mlp_disp = plot_partial_dependence(mlp, X, ["age"],
                                   ax=tree_disp.axes_, line_kw={"c": "red"})
/home/circleci/project/sklearn/tree/_classes.py:1254: FutureWarning: the classes_ attribute is to be deprecated from version 0.22 and will be removed in 0.24.
  warnings.warn(msg, FutureWarning)
腳本的總運行時間:(0分鐘5.157秒)