比較有鄰域成分分析與無鄰域成分分析的最近鄰域?
本案例比較了有領域成分分析和無領域成分分析的兩種最近鄰分類算法。
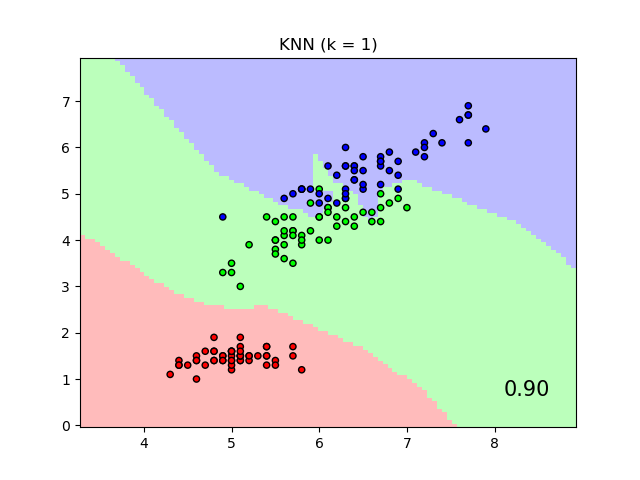
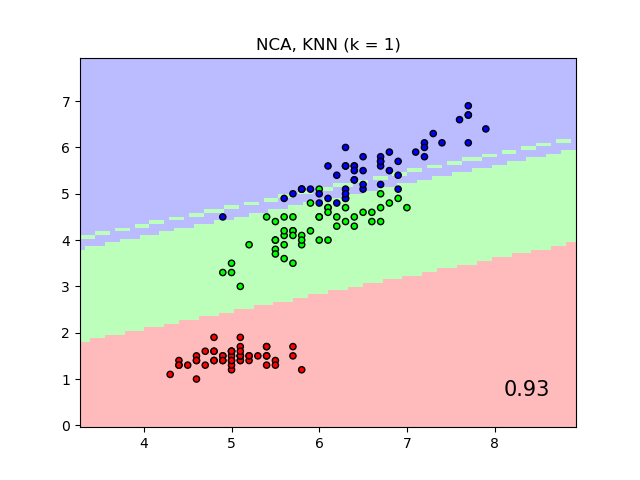
當在原始特征上使用歐幾里得距離時,它將使用最近鄰分類器給出的標簽類別的決策邊界作圖,而不是通過鄰域成分分析學習到的變換后的歐幾里得距離作圖。后者的目的是找到一個線性變換,以最大化訓練集上的(隨機)最近鄰分類精度。
輸入:
# 執照: BSD 3 clause

import numpy as np
import matplotlib.pyplot as plt
from matplotlib.colors import ListedColormap
from sklearn import datasets
from sklearn.model_selection import train_test_split
from sklearn.preprocessing import StandardScaler
from sklearn.neighbors import (KNeighborsClassifier,
                               NeighborhoodComponentsAnalysis)
from sklearn.pipeline import Pipeline


print(__doc__)

n_neighbors = 1

dataset = datasets.load_iris()
X, y = dataset.data, dataset.target

# 我們只使用兩個特征,以此來避免必須使用復雜的切片
X = X[:, [0, 2]]

X_train, X_test, y_train, y_test = \
    train_test_split(X, y, stratify=y, test_size=0.7, random_state=42)

h = .01  # 網格中的步長

# 創建色譜
cmap_light = ListedColormap(['#FFAAAA', '#AAFFAA', '#AAAAFF'])
cmap_bold = ListedColormap(['#FF0000', '#00FF00', '#0000FF'])

names = ['KNN', 'NCA, KNN']

classifiers = [Pipeline([('scaler', StandardScaler()),
                         ('knn', KNeighborsClassifier(n_neighbors=n_neighbors))
                         ]),
               Pipeline([('scaler', StandardScaler()),
                         ('nca', NeighborhoodComponentsAnalysis()),
                         ('knn', KNeighborsClassifier(n_neighbors=n_neighbors))
                         ])
               ]

x_min, x_max = X[:, 0].min() - 1, X[:, 0].max() + 1
y_min, y_max = X[:, 1].min() - 1, X[:, 1].max() + 1
xx, yy = np.meshgrid(np.arange(x_min, x_max, h),
                     np.arange(y_min, y_max, h))

for name, clf in zip(names, classifiers):

    clf.fit(X_train, y_train)
    score = clf.score(X_test, y_test)

    # 繪制決策邊界。為此,我們將為網格[x_min,x_max] x [y_min,y_max]中的每個點分配顏色。
    Z = clf.predict(np.c_[xx.ravel(), yy.ravel()])

    # 將結果放入顏色盤
    Z = Z.reshape(xx.shape)
    plt.figure()
    plt.pcolormesh(xx, yy, Z, cmap=cmap_light, alpha=.8)

    # 還要繪制訓練和測試點
    plt.scatter(X[:, 0], X[:, 1], c=y, cmap=cmap_bold, edgecolor='k', s=20)
    plt.xlim(xx.min(), xx.max())
    plt.ylim(yy.min(), yy.max())
    plt.title("{} (k = {})".format(name, n_neighbors))
    plt.text(0.9, 0.1, '{:.2f}'.format(score), size=15,
             ha='center', va='center', transform=plt.gca().transAxes)

plt.show()
腳本的總運行時間:(0分鐘21.280秒)