sklearn.metrics.plot_confusion_matrix?
sklearn.metrics.plot_confusion_matrix(estimator, X, y_true, *, labels=None, sample_weight=None, normalize=None, display_labels=None, include_values=True, xticks_rotation='horizontal', values_format=None, cmap='viridis', ax=None)
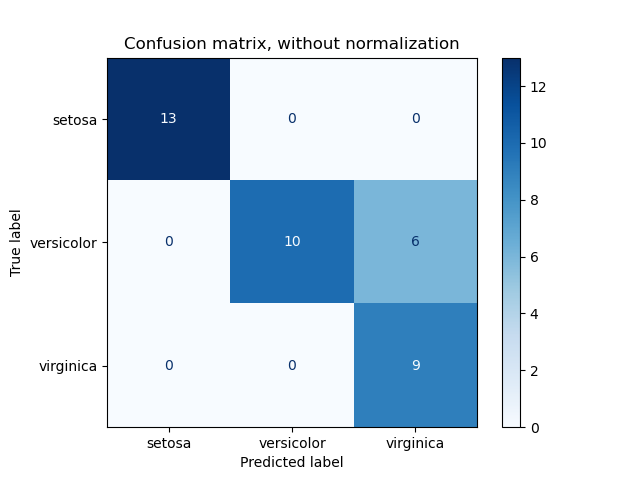
繪制混淆矩陣。
在用戶指南中閱讀更多內容。
| 參數 | 說明 |
|---|---|
| estimator | estimator instance 擬合分類器或擬合 Pipeline,其中最后一個評估器是分類器。 |
| X | {array-like, sparse matrix} of shape (n_samples, n_features) 輸入值 |
| y | array-like of shape (n_samples,) 目標值 |
| labels | array-like of shape (n_classes,), default=None 索引矩陣的標簽列表。可用于重新排序或選擇標簽的子集。如果是None,則y_true或y_pred至少出現一次的那些將按排序順序使用。 |
| sample_weight | array-like of shape (n_samples,), default=None 樣本權重。 |
| normalize | {‘true’, ‘pred’, ‘all’}, default=None 對真實(行),預測(列)條件或所有總體的混淆矩陣進行歸一化。 如果為None,則不會對混淆矩陣進行歸一化。 |
| display_labels | array-like of shape (n_classes,), default=None 用于繪圖的目標名稱。默認情況下,將使用標簽(如果已定義),否則將使用y_true和y_pred的唯一標簽。 |
| include_values | bool, default=True 包括混淆矩陣中的值。 |
| xticks_rotation | {‘vertical’, ‘horizontal’} or float, default=’horizontal’ xtick標簽的旋轉。 |
| values_format | str, default=None 混淆矩陣中值的格式規范。如果為None,則格式說明為‘d’或‘.2g’,以較短者為準。 |
| cmap | str or matplotlib Colormap, default=’viridis’ matplotlib識別的顏色圖。 |
| ax | matplotlib Axes, default=None 軸對象進行繪制。如果為None,則將創建新的圖形和軸。 |
| 返回值 | 說明 |
|---|---|
| display | ConfusionMatrixDisplay |
示例
>>> import matplotlib.pyplot as plt  # doctest: +SKIP
>>> from sklearn.datasets import make_classification
>>> from sklearn.metrics import plot_confusion_matrix
>>> from sklearn.model_selection import train_test_split
>>> from sklearn.svm import SVC
>>> X, y = make_classification(random_state=0)
>>> X_train, X_test, y_train, y_test = train_test_split(
...         X, y, random_state=0)
>>> clf = SVC(random_state=0)
>>> clf.fit(X_train, y_train)
SVC(random_state=0)
>>> plot_confusion_matrix(clf, X_test, y_test)  # doctest: +SKIP
>>> plt.show()  # doctest: +SKIP