sklearn.metrics.plot_precision_recall_curve?
sklearn.metrics.plot_precision_recall_curve(estimator, X, y, *, sample_weight=None, response_method='auto', name=None, ax=None, **kwargs)
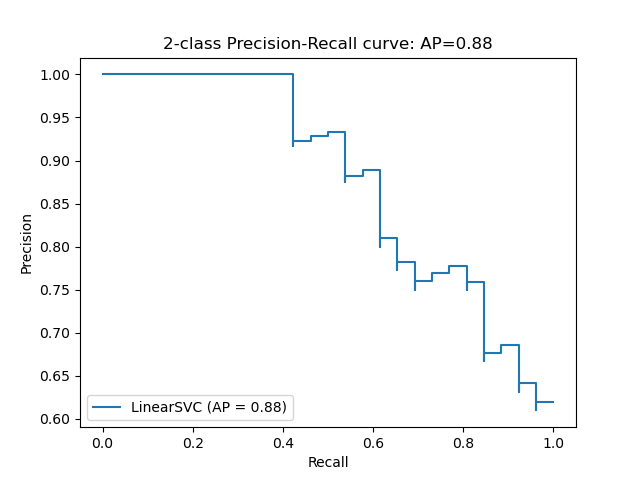
繪制二元分類器的精確召回曲線。
額外的關鍵字參數將傳遞到matplotlib的plot中。
在用戶指南中閱讀更多內容。
| 參數 | 說明 |
|---|---|
| estimator | estimator instance 擬合分類器或擬合 Pipeline,其中最后一個評估器是分類器。 |
| X | {array-like, sparse matrix} of shape (n_samples, n_features) 輸入值。 |
| y | array-like of shape (n_samples,) 二進制目標值。 |
| sample_weight | array-like of shape (n_samples,), default=None 樣本權重。 |
| response_method | {‘predict_proba’, ‘decision_function’, ‘auto’}, default=’auto’ 指定是使用predict_proba還是decision_function作為目標響應。 如果設置為‘auto’,則先嘗試使用predict_proba,如果不存在,則首先嘗試decision_function。 |
| name | str, default=None 標記曲線的名稱。如果為None,則使用評估器的名稱。 |
| ax | matplotlib axes, default=None 要繪制的軸對象。如果為None,則將創建新的圖形和軸。 |
| **kwargs | dict 將傳遞給matplotlib圖的關鍵字參數。 |
| 返回值 | 說明 |
|---|---|
| display | PrecisionRecallDisplay存儲計算值的對象。 |