sklearn.calibration.calibration_curve?
sklearn.calibration.calibration_curve(y_true, y_prob, *, normalize=False, n_bins=5, strategy='uniform')
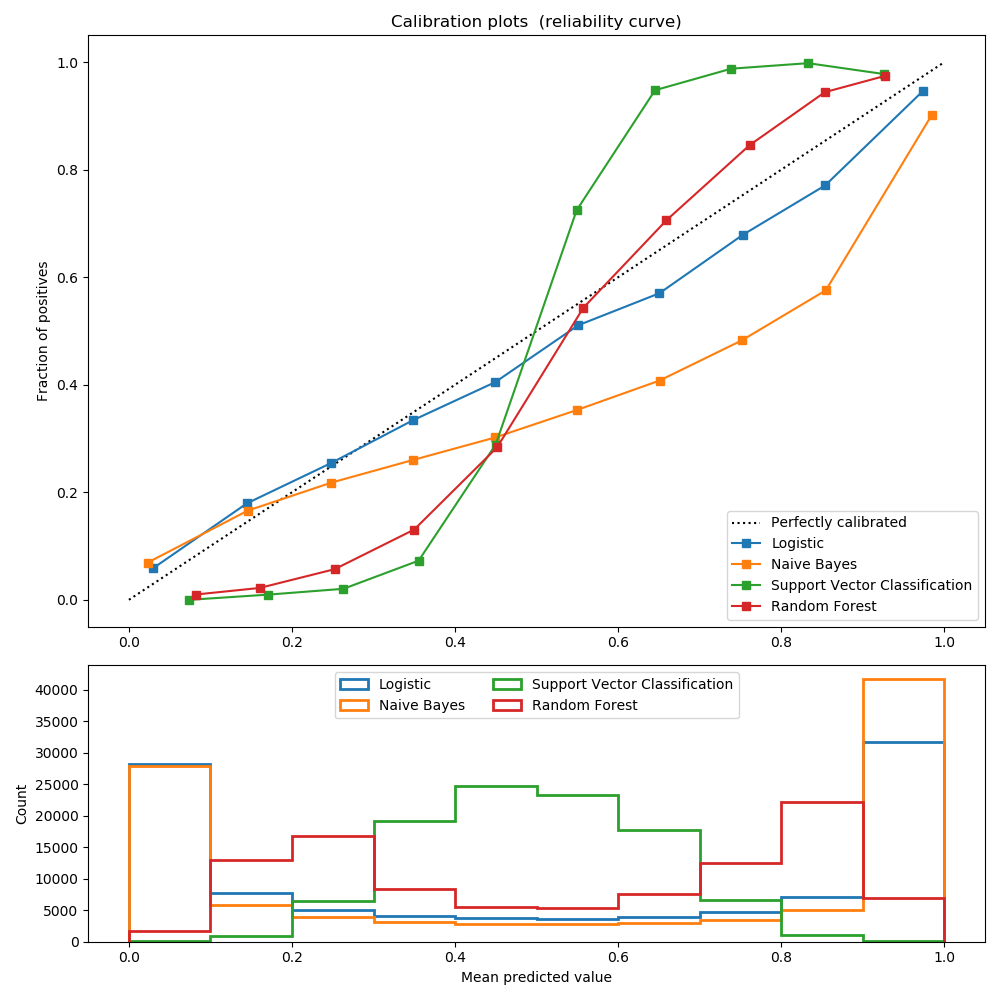
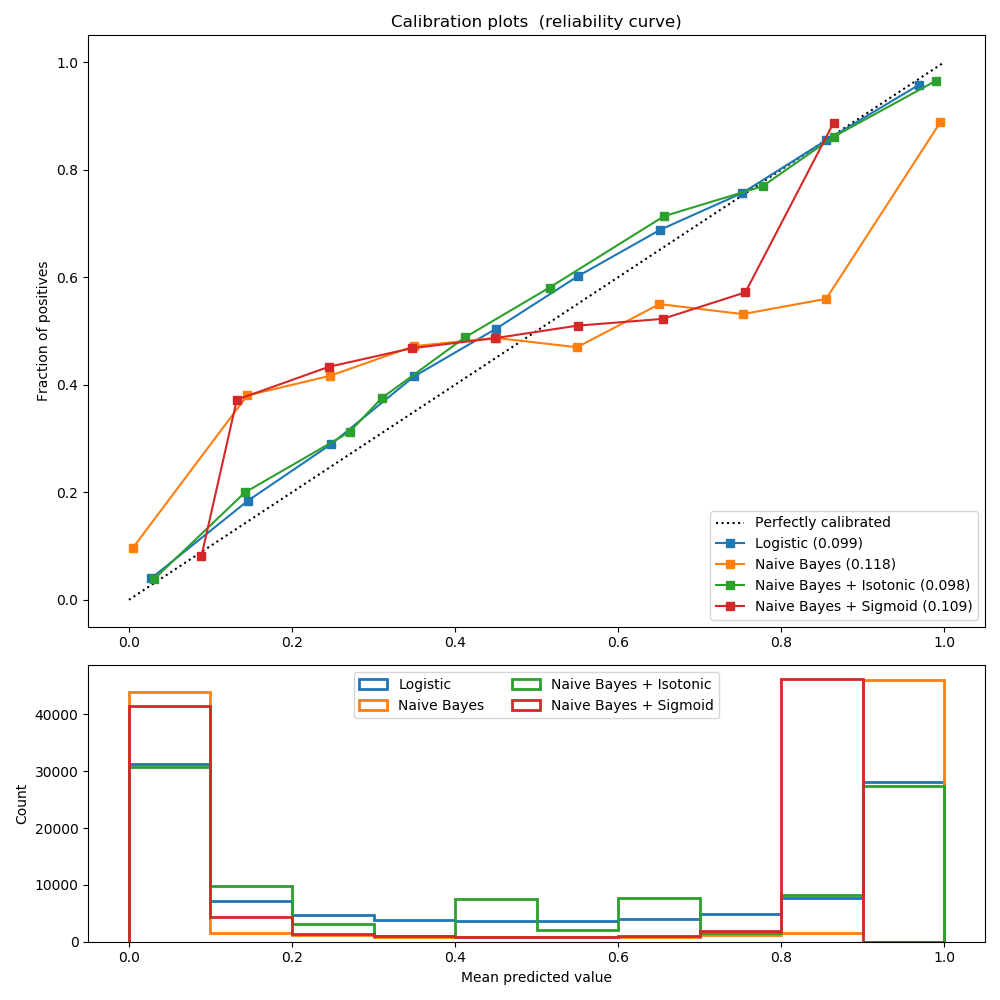
計算校準曲線的真正概率和預測概率。
該方法假定輸入來自二進制分類器,并將其隔離散為[0,1], 放進箱子。
校準曲線也可稱為可靠性圖。
在用戶指南中閱讀更多內容。
| 參數 | 說明 |
|---|---|
| y_true | array-like of shape (n_samples,) 真實目標值 |
| y_prob | array-like of shape (n_samples,) 正類概率 |
| normalize | bool, default=False 是否需要將y_prob歸一化為[0,1]區間,即不是一個適當的概率。如果為真,y_prob中的最小值線性映射到0,最大值映射到1。 |
| n_bins | int, default=5 [0,1]間隔的桶數。更多的值需要更多的數據。沒有樣本的箱子(即 y_prob中沒有相應的值)將不會被返回,因此返回的數組的值可能小于n_bins值。 |
| strategy | {‘uniform’, ‘quantile’}, default=’uniform’ 用于定義箱子寬度的策略 uniform:箱子的寬度是相同的 quantile:這些箱子有相同數量的樣本,依賴于 y_prob。 |
| 返回 | 說明 |
|---|---|
| prob_true | ndarray of shape (n_bins,) or smaller 每個箱子中正類樣本的比例(分數) |
| prob_pred | ndarray of shape (n_bins,) or smaller 每個箱子的平均預測概率。 |
參考:
Alexandru Niculescu-Mizil and Rich Caruana (2005) Predicting Good Probabilities With Supervised Learning, in Proceedings of the 22nd International Conference on Machine Learning (ICML). See section 4 (Qualitative Analysis of Predictions)