sklearn.metrics.plot_roc_curve?
sklearn.metrics.plot_roc_curve(estimator, X, y, *, sample_weight=None, drop_intermediate=True, response_method='auto', name=None, ax=None, **kwargs)
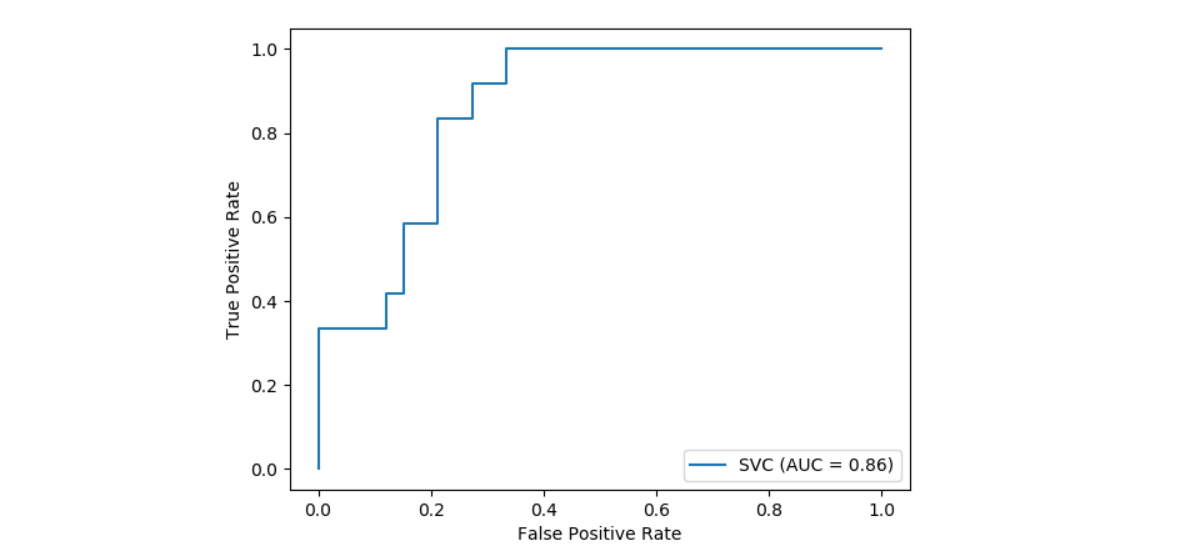
繪制接收器工作特性(ROC)曲線。
額外的關鍵字參數將傳遞到matplotlib的plot中。
在用戶指南中閱讀更多內容。
| 參數 | 說明 |
|---|---|
| estimator | estimator instance 擬合分類器或擬合 Pipeline,其中最后一個評估器是分類器。 |
| X | {array-like, sparse matrix} of shape (n_samples, n_features) 輸入值。 |
| y | array-like of shape (n_samples,) 目標值。 |
| sample_weight | array-like of shape (n_samples,), default=None 樣本權重。 |
| drop_intermediate | boolean, default=True 是否降低一些未達到最佳閾值的閾值,這些閾值不會出現在繪制的ROC曲線上。 這對于創建較淺的ROC曲線很有用。 |
| response_method | {‘predict_proba’, ‘decision_function’, ‘auto’} default=’auto’ 指定是使用predict_proba還是decision_function作為目標響應。 如果設置為‘auto’,則先嘗試使用predict_proba,如果不存在,則首先嘗試decision_function。 |
| name | str, default=None 用于標記的ROC曲線的名稱。 如果為None,請使用評估器的名稱。 |
| ax | matplotlib axes, default=None 要進行繪制的軸對象。如果為None,則將創建新的圖形和軸。 |
| 返回值 | 說明 |
|---|---|
| display | RocCurveDisplay存儲計算值的對象。 |
示例
>>> import matplotlib.pyplot as plt  # doctest: +SKIP
>>> from sklearn import datasets, metrics, model_selection, svm
>>> X, y = datasets.make_classification(random_state=0)
>>> X_train, X_test, y_train, y_test = model_selection.train_test_split(            X, y, random_state=0)
>>> clf = svm.SVC(random_state=0)
>>> clf.fit(X_train, y_train)
SVC(random_state=0)
>>> metrics.plot_roc_curve(clf, X_test, y_test)  # doctest: +SKIP
>>> plt.show()