sklearn.inspection.plot_partial_dependence?
sklearn.inspection.plot_partial_dependence(estimator, X, features, *, feature_names=None, target=None, response_method='auto', n_cols=3, grid_resolution=100, percentiles=(0.05, 0.95), method='auto', n_jobs=None, verbose=0, fig=None, line_kw=None, contour_kw=None, ax=None)
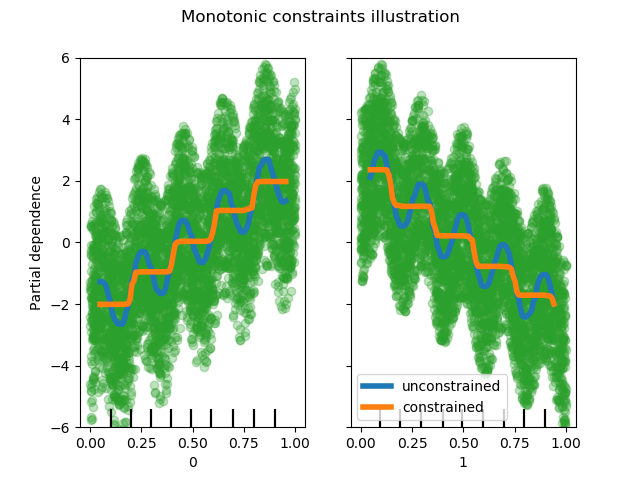
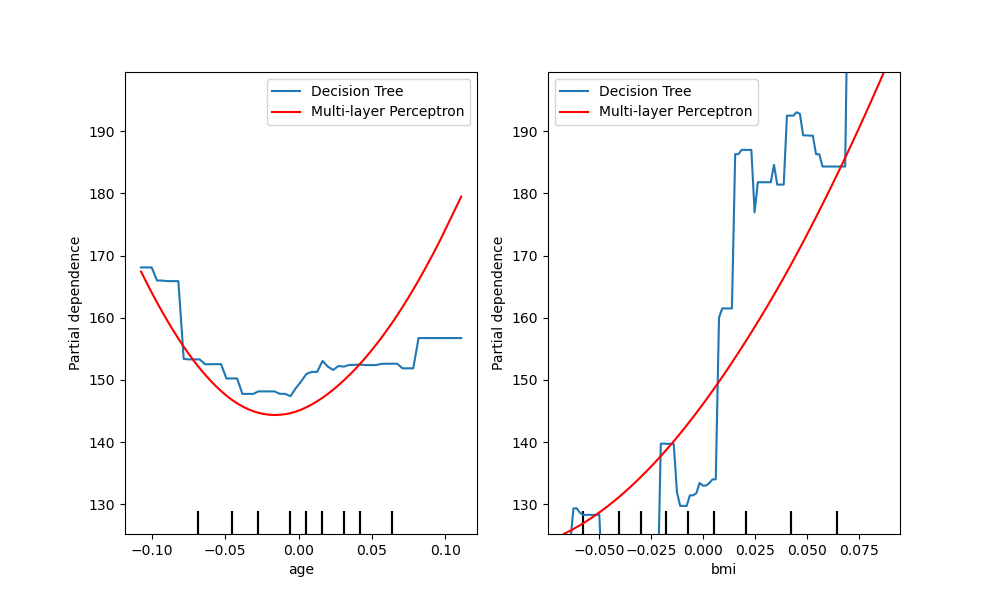
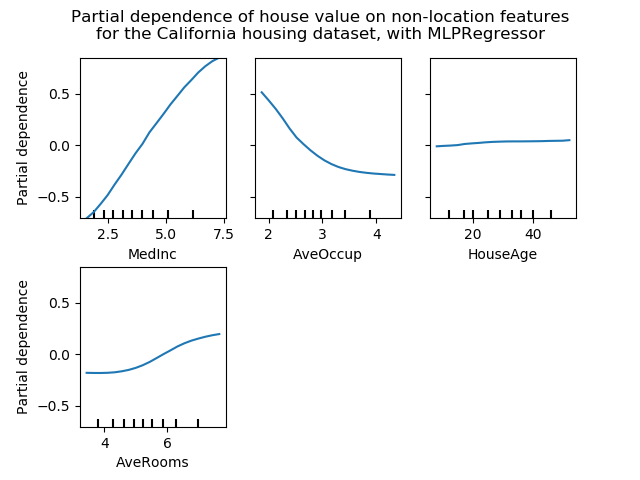
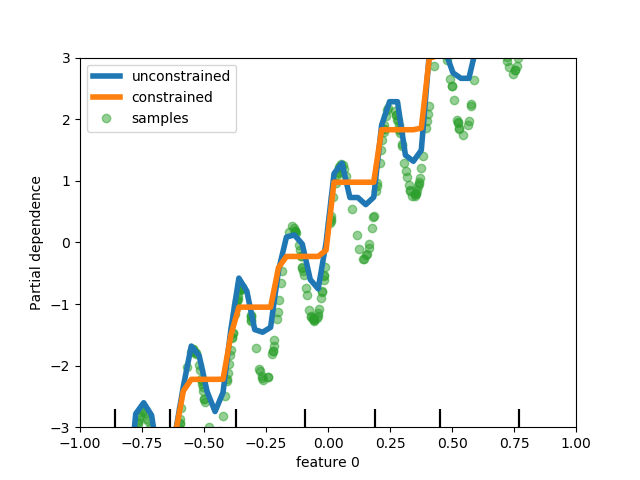
部分依賴圖。
這些len(features)圖以帶n_cols 列的網格形式排列。雙向偏相關圖被繪制為等高線圖。對于單向繪圖,特征值的十分位數將在刻度上顯示刻度線,對于雙向繪圖,將在兩個軸上顯示刻度線。
在用戶指南中閱讀更多內容。
注意:plot_partial_dependence不支持在多個調用中使用相同的軸。要繪制多個估計量的偏相關性,請將第一個調用創建的軸傳遞給第二個調用:
>>> from sklearn.inspection import plot_partial_dependence
>>> from sklearn.datasets import make_friedman1
>>> from sklearn.linear_model import LinearRegression
>>> X, y = make_friedman1()
>>> est = LinearRegression().fit(X, y)
>>> disp1 = plot_partial_dependence(est, X)
>>> disp2 = plot_partial_dependence(est, X,
...                                 ax=disp1.axes_)
警告:對于GradientBoostingClassifier和 GradientBoostingRegressor,“recursion”方法(默認使用)將不考慮提升過程的init預測因子。實際上,init是常量估計器(默認),這將產生與“brute”相同的值,直到目標響應中的偏移量恒定。但是,如果init不是常量估計量,則部分相關性值對于“recursion”是不正確的,因為偏移量將取決于樣本。最好使用“brute”方法。請注意,這僅適用于 GradientBoostingClassifier和 GradientBoostingRegressor,不適用于 HistGradientBoostingClassifier和 HistGradientBoostingRegressor。
| 參數 | 說明 |
|---|---|
| estimator | BaseEstimator 一個合適的估計對象,實現了預測, 預測或決策函數。不支持多輸出多類分類器。 |
| X | {array-like or dataframe} of shape (n_samples, n_features) X用于為目標 features(其中部分依賴將被評估)生成一個值網格,也用于在method為‘brute’時為補充特征生成值。 |
| features | list of {int, str, pair of int, pair of str} 要為其創建PDP的目標特征。如果features [i]是一個int或字符串,則將創建一個單向PDP;如果features [i]是一個元組,則會創建一個雙向PDP。每個元組的大小必須為2。如果傳入的是字符串,則它必須在 feature_names中。 |
| feature_names | array-like of shape (n_features,), dtype=str, default=None 每個特征的名稱;feature_names [i]保存索引為i的特征名稱。默認情況下,特征的名稱對應于NumPy數組的數字索引和pandas數據框的列名稱。 |
| target | int, optional (default=None) - 在多類設置中,指定應為其計算PDP的類。請注意,對于二進制分類,始終使用正類(索引為1)。 - 在多輸出設置中,指定應為其計算PDP的任務。 在二進制分類或經典回歸設置中被忽略。 |
| response_method | ‘auto’, ‘predict_proba’ or ‘decision_function’, optional (default=’auto’) 指定是使用predict_proba還是 decision_function作為目標響應。對于回歸變量,將忽略此參數,并且響應始終是預測的輸出 。默認情況下,最先嘗試使用predict_proba,如果不存在,將恢復為decision_function。如果 method是“recursion”,響應輸出總是 decision_function。 |
| n_cols | int, optional (default=3) 網格圖中的最大列數。僅在 ax 為單軸或None時有效。 |
| grid_resolution | int, optional (default=100) 對于每個目標特征,在繪圖軸上等距的點數。 |
| percentiles | tuple of float, optional (default=(0.05, 0.95)) 上下百分比,用于為PDP軸創建極值。必須在[0,1]中。 |
| method | str, optional (default=’auto’) 用于計算平均預測的方法: - “recursion”只支持一些基于樹的估計(即 GradientBoostingClassifier, GradientBoostingRegressor, HistGradientBoostingClassifier, HistGradientBoostingRegressor, DecisionTreeRegressor, RandomForestRegressor 但在速度方面更有效率。通過這種方法,分類的目標響應始終是決策函數,而不是預測的概率。- 'brute' 任何估算器均支持,但計算量更大。 - 'auto':'recursion'用于支持它的估計器,否則使用'brute'。 請參閱此注釋,以了解“brute”和“recursion”方法之間的區別。 |
| n_jobs | int, optional (default=None) 用于計算部分依賴關系的CPU數量。 除非上下文中設置了 joblib.parallel_backend,否則None表示1 。 -1表示使用所有處理器。有關更多詳細信息,請參見詞匯表。 |
| verbose | int, optional (default=0) PD計算期間的輸出詳細程度。 |
| fig | Matplotlib figure object, optional (default=None) 一個圖形對象,在圖形被清除后,將在其上繪制圖形。默認情況下,會創建一個新的。 自0.22版本起已棄用: fig將在0.24中刪除。 |
| line_kw | dict, optional 對于單向偏相關圖,包含傳遞給 matplotlib.pyplot.plot的關鍵字字典。 |
| contour_kw | dict, optional 對于雙向部分依賴圖,包含傳遞給 matplotlib.pyplot.contourf的關鍵字字典。 |
| ax | Matplotlib axes or array-like of Matplotlib axes, default=None - 如果傳入單個軸,則將其視為邊界軸,并在這些邊界內繪制部分依賴圖網格。 n_cols參數控制網格中的列數。- 如果傳入一個類數組的軸,則部分依賴圖將直接繪制到這些軸中。 - 如果 None,則創建圖形和邊界軸,并將其視為單軸情況。 |
| 返回值 | 說明 |
|---|---|
| display | PartialDependenceDisplay |
另見
sklearn.inspection.partial_dependence返回原始的部分依賴值
示例
>>> from sklearn.datasets import make_friedman1
>>> from sklearn.ensemble import GradientBoostingRegressor
>>> X, y = make_friedman1()
>>> clf = GradientBoostingRegressor(n_estimators=10).fit(X, y)
>>> plot_partial_dependence(clf, X, [0, (0, 1)]) #doctest: +SKIP